IELTS graph writing # 213 - Bar chart shows the global sales of televisions
- Details
- Last Updated: Wednesday, 26 August 2020 00:10
- Written by IELTS Mentor
- Hits: 21677
IELTS Academic Writing Task 1/ Graph Writing - Column/Bar Graph:
» You should spend about 20 minutes on this task.
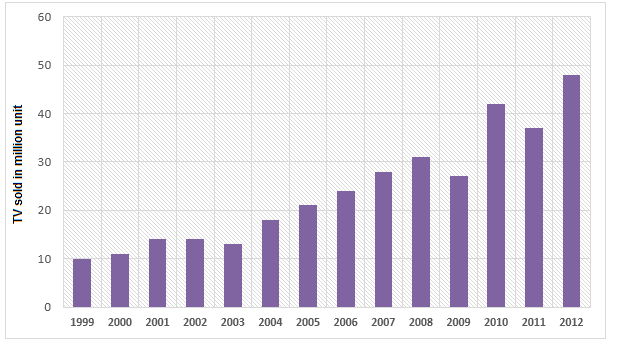
The bar chart below shows the global sales of televisions by Supervision Incorporation from 1999 to 2012.
Summarise the information by selecting and reporting the main features, and make comparisons where relevant.
» You should write at least 150 words.
Television Sales by Supervision Incorporation (in millions)
Sample Answer:
The bar chart presents data on the global TV sales from 1999 to 2012, over a period of 14 years, by the Supervision Incorporation. The sales volume is given in million units and it is obvious that sales amount of this company increased with some fluctuations over the time.
Getting back to the details, 10 million TVs were sold by Supervision Incorporation worldwide in 1999 and it increased by 3 to 5 million in 2002 and 2003. The sales amount dropped a bit in the next year and then rose again in 2004 with a figure of nearly 20 million sales. From this point, there was a steady progress in the television sales and the number went over 30 million in 2008. The company witnessed a decline in its sales in 2009 compared to the previous year’s sale. The global TV sales in 2010 by this manufacturer went well over 40 million which was just double than that of 2005. Finally, with a slight dip in 2011, the sales volume of TVs by this company in 2012 reached to around 48.5 million.

Report