IELTS graph writing # 212 - Cases of diseases caused by X virus in Australia
- Details
- Last Updated: Wednesday, 26 August 2020 00:09
- Written by IELTS Mentor
- Hits: 19413
IELTS Academic Writing Task 1/ Graph Writing - Line Graph:
» You should spend about 20 minutes on this task.
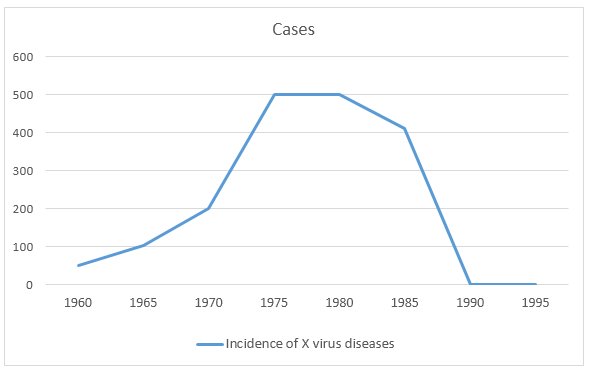
The line graph below shows the cases of diseases caused by X virus in Australia from 1960 to 1995.
Summarise the information by selecting and reporting the main features, and make comparisons where relevant.
» You should write at least 150 words.
Model Answer 1:
The line graph gives data on the X virus diseases reported from 1960 to 1995 in Australia. The horizontal line presents years while the vertical line shows the number of reported cases.
Overall, the highest number of X virus-related incidents occurred from 1975 to 1080 in Australia and after 1990, this virus could not cause any more illness in Australia.
As can be seen in the illustration, the number of affected people from the X virus stood at only 50 in 1960 and in the next 10 years, it gradually increased. Two hundred people were infected in 1970 and afterwards, the fatality sharply increased and reached a peak, at 500 cases in 1975. This number remained stable over the next 5 years and then decreased by 100 in 1985. However, the recorded illness due to this virus in the next 5 years slumped, and in 1990, not a single case of X virus-related disease was found in Australia. During the last five years, from 1990 to 1995, no one was reported to become sick from the attack of this virus in Australia.
Model Answer 2:
The line graph shows the changes in the number of X virus cases in Australia, throughout 35 years, starting from 1960. Overall, most cases took place between 1975 and 1980 and after 1990, no cases from this virus was reported in Australia.
To begin with, in 1960, around 50 cases from the X virus was reported in Australia. As the years went by, the figure increased, which had been exactly 100 in 1965. The most significant increase came as the disease skyrocketed and reached a peak, at 500 cases in 1975.
The number of cases remained at the peak, 500 cases, for 5 years before decreasing by almost 100 in 1985. And finally, from 1990, it can be seen that the X virus no longer created any illnesses for Australian people. The most significant change in the number of cases came between the years 1970-1975 and 1985-1990. On the other hand, the X virus had the largest impact on Australia between 1975 and 1985.
[Written by - Nguyen Thuong Vu]

Report