IELTS graph 231 - Pulse rate changes between two different individuals
- Details
- Last Updated: Wednesday, 26 August 2020 00:15
- Written by IELTS Mentor
- Hits: 29253
IELTS Academic Writing Task 1/ Graph Writing - Line Graph:
» You should spend about 20 minutes on this task.
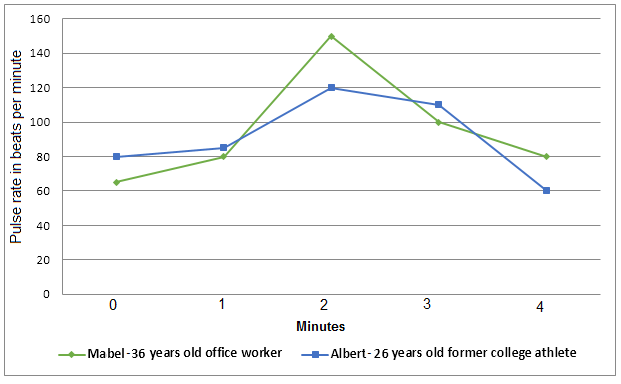
The graph shows a comparison in the pulse rate changes between two different individuals of different ages and professions.
Write a report for a university tutor describing the information shown in the diagrams below.
Write at least 150 words.
Exercise and pulse rate
Sample Answer 1:
The line graph compares the heart beats of two individuals – Mabel, a 36 years old office worker, and Albert, a 26 years old former college athlete, during their four minute exercise period. Overall, office worker’s heart beat rate was lower before starting the exercise but in third and final minutes, his pulse rate was recorded higher.
Getting back to the details, Mabel, who works in an office, has a pulse rate of roughly 62-65 per minute. Albert, on the contrary, is a former college athlete who has a pulse rate of 80 per minute. Their pulse rates changed during the workout and after one minute both of their health beats became approximately 80. When two minutes elapsed, Mabel’s pulse rate dramatically increased to around 150 while it was 120 for Albert. After three minutes of exercise, office worker Mabel’s heart beating was recorded roughly 110 while the former athlete’s pulse rate was precisely 100. After 4 minutes, both of their pulse rate dipped and it was 60 for Albert while 80 for Mabel.
Model Answer 2:
The line graph compares the pulse rate changes of two individuals, Mabel and Albert. In particular, physical exercise escalates the heart beats of two individuals of different ages and professions differently. In this case, young athlete's pulse rate is less intense than that of a mid-thirties office employee.
According to the line graph, 36 years old office worker, Mabel's initial pulse rate was between 62-65 which was precisely 80 in the case of Albert, a 26 years old former college athlete. After one minute's exercise, both of their heart beats escalated to roughly 80 per minute. In two minutes, Mabel's pulse rate increased steeply and reached 150 while Albert's heart beat rate at that time was 120. In the next minute, Mabel's pulse rate dipped sharply to 100 per minute while Albert's pulse rate slightly fell and reached to 110. In the final minute, both of their pulse rates plummeted and it was 80 for Mable and 60 for Albert.

Overall, the pulse of the former seems to be more stable. More specific information will be summarized below.
To begin with, before the beginning of exercise, Mabel's heart beats approximately 62 times while for Albert, this figure is precisely 80. It is obviously shown that after a minute of the workout session, Mabel's pulse rate increases to 80 as that of Albert rose marginally.
The most noticeable feature of the graph is when the pulse rate of Mabel overtook Albert's. In detail, it rises to 150, meaning an almost 2-fold increase just in the next minute. Meanwhile, Albert's heart beats 120 times. The figures at this time are also at the highest point for both men.
Afterwards, their pulse rates decrease steeply as time goes by. At the end of the given 4-minute period, pulse rates of the office worker and the athlete become 80 and 60, respectively. It is worth noticing that the heartbeat rate of one man at the beginning of the exercise is almost exactly the same as that of the other person by the end of the given period.
Report