IELTS graph 236 - Consumption of regular ice cream in the US
- Details
- Last Updated: Wednesday, 26 July 2017 14:04
- Written by IELTS Mentor
- Hits: 22784
IELTS Academic Writing Task 1/ Graph Writing - Bar/ Column Graph:
» You should spend about 20 minutes on this task.
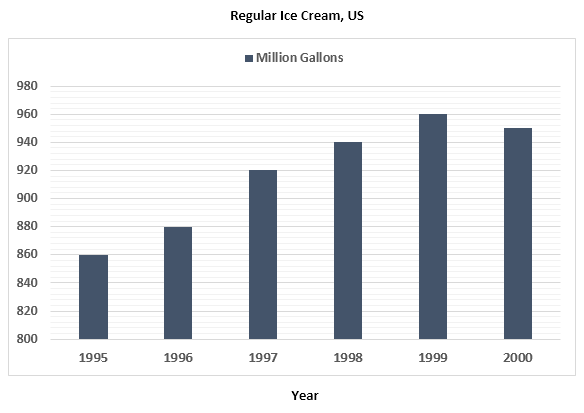
The column graph below shows the consumption of regular ice cream in the US market.
Summarise the information by selecting and reporting the main features and make comparisons where relevant.
Write at least 150 words.
Sample Answer:
The column graph shows yearly ice cream consumptions in the USA from 1995 to 2000. The unit is given in million gallons and the consumption includes regular ice creams in the US market. Overall, the ice cream intake by the US citizens increased over the years and this consumption was the highest in the year 1999.
According to the illustration, American citizens ate 860 million gallons regular ice cream in 1995 which increased by 20 million gallons in the next year. The consumption further increased in next three years with an average increase of 20 million gallons each year. In 1999, the ice cream consumption by the US citizens stood at 960 which was 100 million gallons higher than the consumption in 1995. After 1999, the intake of regular ice cream dropped by approximately 10 million gallons, which was an exception to the trend shown in the bar graph. This is the only year when ice cream consumption by Americans actually decreased compared to the previous year.

Overall, the amount of ice-cream consumption in the USA market rose gradually over time.
In terms of the data, the amount of ice-cream consumption went up significantly between 1995 and 1999, from 860 to 880 million gallons. Next year, American citizens consumed 40 million gallons more ice-cream. It kept on increasing every year till 1999 when it reached to a consumption figure of 960 million gallons. Moreover, in the year 1999, the figure reached a peak while immediately in the next year, this figure went down slightly and left at about 950 million gallons. It is obvious that The consumption rate of ice cream in the US market in the five years (1995, 1996, 1997, 1998, and 1999) increased. In 2000, it decreased slightly than the previous year.
Report