IELTS graph 241 - Temperature in Antarctica in June 2015
- Details
- Last Updated: Thursday, 27 July 2017 11:55
- Written by IELTS Mentor
- Hits: 20788
IELTS Academic Writing Task 1/ Graph Writing - Line Graph:
» You should spend about 20 minutes on this task.
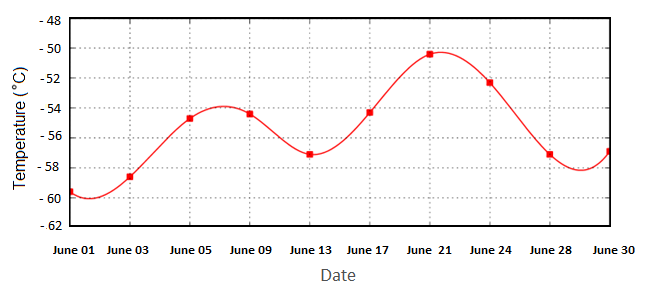
The graph below shows the average temperature in Antarctica in June 2015.
Summarise the information by selecting and reporting the main features and make comparisons where relevant.
Write at least 150 words.
Antarctica's Temperature in June 2015
Sample Answer:
The line graph shows data on the average daily temperature of Antarctica in June 2015. The temperature is given in centigrade by the dates of the month. As can be seen, the temperature fluctuated from minus 50 to minus 60 degree centigrade.
According to the illustration, Antarctica’s temperature on the first June was as low as minus 60-degree centigrade and in a week, this temperature went up. On the seventh day of the month, the temperature reached to -54 degree. On 9th June it stood at just below -53 degree and in the next 4 days, it became -57. In the mid-June, the temperature in Antarctica was recorded around minus 58 degree. After that, the temperature slightly increased and on 21st June it rose to -50 degree approximately. From this point, the temperature kept on falling before reaching to -58 on 29th June. On the last day of the month, Antarctica’s temperature was around -57 degree centigrade which was almost the same as it was on the 3rd day of the month.

Report