IELTS graph 244 - Number of own operated and Franchised restaurants
- Details
- Last Updated: Monday, 31 July 2017 17:21
- Written by IELTS Mentor
- Hits: 15867
IELTS Academic Writing Task 1/ Graph Writing - Bar Graph:
» You should spend about 20 minutes on this task.
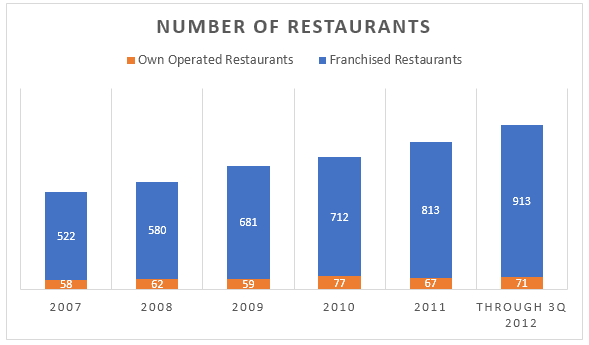
The bar graph below shows the number of own operated and Franchised restaurants from 2007 to 2012 in Someland.
Summarise the information by selecting and reporting the main features and make comparisons where relevant.
Write at least 150 words.
Sample Answer:
The graph shows data on the number of personally owned and franchised restaurants in Someland from 2007 to the third quarter of 2012. Generally speaking, the growth in the number of franchised restaurants were far higher than that of personal ones.
According to the illustration, the number of licensed franchised restaurants in 2007 was 522 which was exactly nine times higher than that of personally managed diners in Someland. Next year, the former increased to 580 whereas the latter went up slightly and its number was 62. In the next year, 2009, another 101 chartered restaurants were established while personally owned restaurant dipped to 59. After two years, the growth of franchised eateries witnessed a hike, accounting 813 in total against only 67 self-managed eateries. In the third quarter of 2012, the total number of franchised diners’ number reached to 913, adding 100 new entities in just 9 months, while this number was 71 for personally controlled eateries. As is obvious, the number of franchised restaurants almost doubled in just 5 years while only 12 new personal restaurants added up with the initial number with a decrease in 2009 and 2011.

Report