IELTS graph 278 - Number and types of books that were borrowed
- Details
- Last Updated: Monday, 13 November 2017 18:20
- Written by IELTS Mentor
- Hits: 107066
IELTS Academic Writing Task 1/ Graph Writing - Line Graph + Pie Chart:
You should spend about 20 minutes on this task.
The line graph shows the number of books that were borrowed in four different months in 2014 from four village libraries, and the pie chart shows the percentages of books, by type, that were borrowed over this time.
Summarize the information by selecting and reporting the main features, and make comparisons where relevant.
You should write at least 150 words.
Number of books borrowed from four village libraries

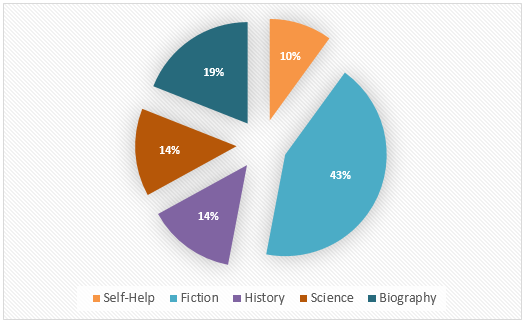
Types of Books Borrowed
Sample Answer:
The line graph outlines the number of books people rented from four rural libraries between June and September 2014 while the Pie chart gives data on the kinds of books that were borrowed from those libraries. Generally speaking, the number of borrowed books fluctuated throughout the months and fiction was the most popular category among those library goers.
As is presented, People borrowed the highest number of books, 300 to be precise, from Ryeslip library in June 2014. With 250 renting, Sutton Wood library stood as the second highest lender of books at that time. West Eaton and Church Mount libraries dispatched 50 books each in June 2014. Interestingly, the number of books subscribers borrowed from Ryeslip library declined steadily over the next three months and in September it forwarded just over 150 books to readers. The most erratic pattern of lending books could be observed for Sutton Wood library but in September it allowed 300 books to be borrowed which was almost double than that of other libraries. Over the months, the book borrowing from West Eaton and Church Mount libraries increased and they showed a similar lending pattern. They each allowed 150 books to it readers in September.
It is obvious that people mostly borrowed fictions from these libraries as more than 40% of borrowed books fell in this category. Borrowing ratio for history and science books accounted for 14% each and that was 5% lower than that of biology books. Self-help books’ borrowing ratio was exactly 10% which indicated one in ten books borrowed had this genre.

Report