IELTS graph 289 - Thefts per thousand vehicles in four countries
- Details
- Last Updated: Sunday, 03 December 2017 19:10
- Written by IELTS Mentor
- Hits: 88458
IELTS Academic Writing Task 1/ Graph Writing - Line Graph:
You should spend about 20 minutes on this task.
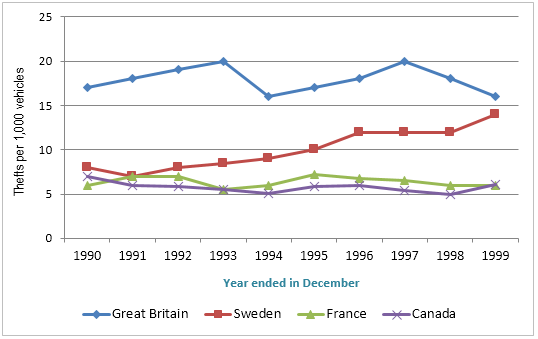
The line graph shows thefts per thousand vehicles in four countries between 1990 and 1999.
Summarize the information by selecting and reporting the main features, and make comparisons where relevant.
You should write at least 150 words.

Sample Answer:
The line graph presents data on vehicle theft cases in Great Britain, Sweden, France and Canada from 1990 to 1999. As is obvious, car thefts in Great Britain were higher than that of other countries while this rate noticeably increased in Sweden.
According to the diagram, roughly 17 transportations in every thousand were stolen in the Great Britain in 1990 while this rate was between 6 to 8 per thousand in France, Canada and Sweden. Automobile embezzlement in Great Britain steadily climbed till 1993 at which point 2% cars were reported abducted. With some minor fluctuations, car lifting rates in France and Canada remained almost constant throughout the years. In contrast, carrier stealing rate in Sweden kept on soaring and in 1995 this proportion reached as high as 10 in every thousand vehicles. Motor vehicle theft in Great Britain sharply declined in 1994 but grew again till 1997 to strike 2% again. Afterwards, car theft incidents in Great Britain firmly declined between 1997 and 1999 when it actually increased in Sweden. Finally, in 1999, almost 1.5% automobiles in Great Britain and Sweden were reported stolen while it was almost one-third of that in France and Canada.

Overall, the most noticeable feature of the diagram is that vehicle thefts cases in Great Britain was higher than the other three countries in the given period.
In detail, first of all, approximately 17 out of a thousand vehicles were stolen in Great Britain in the year 1990. Despite some fluctuations throughout 10 years, the number was almost the same in the end. As obvious, vehicle thefts in the country reached the peak in both 1993 and 1997 (about 20 stolen cars per thousand).
However, it was Sweden where the biggest change took place. An enormous increase can easily be seen, as the figure in 1999 (14 vehicle thefts per thousand) doubled in just ten years.
In sharp contrast with the two mentioned countries, automobile thefts in Canada and France were relatively stable between 1990 and 1999. In that period, the number remained between 5 to 7 stolen cars per thousand. In each year, except for 1990, Canada had a slightly smaller or equal figure of vehicle thefts in comparison with France.
And finally, another look at the diagram suggests that in 1994, vehicle thefts in four countries combined were the lowest. Additionally, still in the year 1994, Great Britain and Canada also had the lowest figure, which was about 16 and 5 per thousand, respectively.
Overall, Great Britain witnessed the highest number of vehicle thefts, while it was comparatively fewer in France and Canada.
To begin with, car thefts in France and Canada were fewer than that of Sweden and Great Britain from 1990 to 1999. A fairly similar pattern of car theft ratio could be observed both in France and Canada which was between 5 to 7 thefts per thousand vehicles per year while Canada often having a lower transportation theft rate than that of France.
On the other hand, this trend in Sweden was a bit higher than that of France and Canda in 1990 but grew steadily and ended up at 14 vehicle thefts per thousand in 1999. Next, the stolen cars in great Britain in 1990 stood at about 17 per thousand, the highest of the four countries. This ratio fluctuated over the years with the highest peak of 20 per thousand in 1992 and 1996.
Overall, Great Britain suffered the highest car theft incidents whereas car stealing in Sweden steadily rose. However, Canada and France experienced almost the same ratio of car thefts during the period with a few minor fluctuations.
According to the graph, car stealing in Great Britain remained unstable throughout the period but the rate was higher than in three other countries. It climbed to its peak in 1993 and 1997 when 2% of cars were reported stolen. In 1999, car stealing cases in Great Britain stood at 16 out of a thousand. Car theft in Sweden grew slowly but almost ceaselessly and in 1999, 14 in 1000 cars were reported stolen there. This rate was less than 1% six years earlier.
However, theft of cars in France and Canada followed a similar pattern throughout the period. French and Canadians had a similar number of cars stolen in 1999 (around 6 cars per thousand). However, the figure of the car-theft in France was slightly higher in 1990, around 9 cars compared to that of Canada.
Report