IELTS graph 313 - Drinking habits of the US population by age
- Details
- Last Updated: Wednesday, 07 February 2018 11:47
- Written by IELTS Mentor
- Hits: 80041
IELTS Academic Writing Task 1/ Graph Writing - Bar/ Column Graph:
You should spend about 20 minutes on this task.
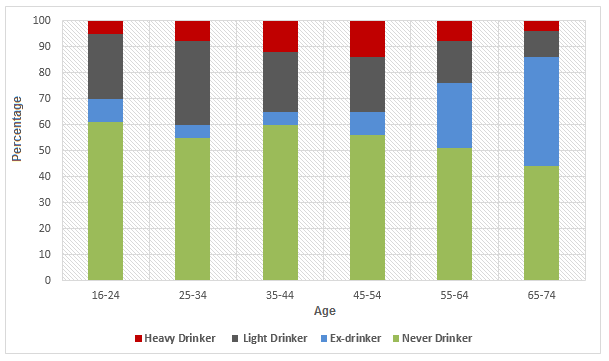
The graph gives information about drinking habits of the US population by age.
Summarise the information by selecting and reporting the main features, and make comparisons where relevant.
You should write at least 150 words.
Drinking habits by age (US)
Sample Answer:
The bar graph outlines the drinking habits of Americans based on their age groups. As can be seen, US citizens’ drinking pattern greatly varies based on their age and elder population over 65 years mostly abstain from drinking.
According to the diagram, 60% US citizens between 16 to 24 years old have never been on alcohol while roughly 10% of them used to drink but now are abstainers. Around one-quarter of these young Americans are light-drinkers while remaining 5% drinks heavily. A similar pattern could be observed among the 25-34 years age group but with an increasing ratio of irregular drinkers and almost 8% hard drinker.
It is interesting to note that chronic alcoholics in the US are highest between 35-54 years population and this ratio is lower among the younger and senior citizens. The rate of people who never have had alcohol declines with the increase of age and a reverse trend could be observed for the ex-drinkers whose proportion hikes as people get older.
The highest ratio of hard drinkers falls between 45-54 years age group and the light drinkers is highest among the 25-34 years old Americans. Finally, an overwhelming number of US population, almost 40%, quit drinking when they are over 64 years old.

Report