IELTS graph 314 - Passengers travelling by train in Sydney and trains running on time
- Details
- Last Updated: Tuesday, 06 February 2018 18:47
- Written by IELTS Mentor
- Hits: 71982
IELTS Academic Writing Task 1/ Graph Writing - Line Graphs:
You should spend about 20 minutes on this task.
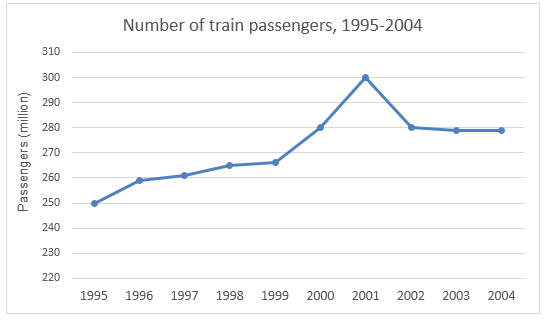
The first graph gives the number of passengers travelling by train in Sydney. The second graph provides information on the percentage of trains running on time.
Summarise the information by selecting and reporting the main features, and make comparisons where relevant.
You should write at least 150 words.

Sample Answer:
The line graphs give data on the number of train commuters in Sydney from 1995 to 2004 and outline the ratio of trains that ran on time during the same period. As an overall trend, the number of rail passengers in Sydney gradually increased between 1995 to 2002 and in 2004 a higher percentage of locomotives failed to run on time.
As the data suggests, 250 million passengers used the train transportations in 1995 in Sydney and this number slowly increased in the next 4 years. In 1999, train commuters' number in Sydney was around 265 million and it abruptly hiked in the next two years before dropping again in 2002. In 2000, 280 million passengers used locomotives and this number further increased and reached to the highest, 300 million, in 2001. From 2002 to 2004 the train commuters’ number remained constant at 280 million.
Besides, more than 92% trains in 1995 arrived and reached their destination on time but this record deteriorated and dropped to just over 85% in 1997. In 2000, almost 15% rails failed to maintain the schedule and this scenario was worst in 2004 when more than 25% trains in Sydney could not run on time.

Increasing from approximately 250 million passengers in 1995 to over 260 million passengers in 1999, the number of Sydney’s train commuters then soared by approximately 40 million and reached a peak at 300 million in 2001. This was followed by a period of slight decline, with around 280 million passengers in 2002 and then the number remained steady until 2004.
The proportion of trains that ran on time, meanwhile, fluctuated at somewhere between 90% and 95% prior to 1995, before dropping slightly to over 85% in 1997. The following six years saw a dramatic fluctuation in this rate, with lows about 85% in 2000 and highs over 90% in 2002. Subsequently, the figure declined considerably with over 70% in 2004.
As can be seen in the first chart, 250 million people in Sydney used the train as their mode of transportation in 1995. The number gradually increased to 265 million until 1999 and then upsurged to a maximum of 300 million by 2001. However, locomotive users in Sidney remained unchanged at an average of 280 million for the next three years.
According to the second line graph, more than 85% of trains in Sydney from 1995 to 2003, managed to arrive and depart on time to their respective destinations. The value fluctuated between 85% and 93% during this period. Interestingly in 2004, more than 25% of locomotives failed to operate on time.
Overall, train commuters in Sydney gradually increased between 1995 to 2004 but the highest number of passengers used trains in 2001. Though the majority of trains in Sydney were on time, their performance was somewhat poor in 2004.
According to the illustration, 250 million people in Sydney took trains to commute in 1995 and their number slowly grew till 1999, when about 265 million passengers took trains. Afterwards, it sharply increased to 300 million in 2001, the highest point, before dropping again in 2002. Next three years, around 280 million citizens used trains as a mean of their transportation.
Most of the trains in Sydney followed the train schedule in 1995 when almost 19 out of 20 trains left or reached stations in time. With some fluctuations, 85 to 95 per cent of times, they were on time. But in 2004, they were in time just around 7 out of 10 times, which was the worst among the given period.
At first glance, it can be seen that the maximum number of people used trains in the year 2001 and the least percentage of trains ran on time in the year 2004.
In the year 1995, 250 million people in Sydney relied on trains as their mode of transportation and approximately 92% of the trains were on time. The passenger number increased gradually for the next five years; however, it surged between the year 1999 and 2001 and reached a peak of 300 million passengers in 2001. From there, it dropped to 280 million in the year 2002 and levelled off for the next two years.
From the second graph, it is clear that the percentage of compliance of trains to their actual running time fluctuated between 85% to 93% until 2003. But in 2004, this ratio plummetted and reached as low as 72% in 2004.
Overall, it is observed that opposing trends can be seen from the two, as the former increased and the latter declined after the years.
To begin with, 250 million passengers travelled by locomotives in 1995 in Sydney, and this figure slightly rose by approximately 15 million four years later. Afterwards, there was a dramatic increase, reaching the peak of 300 million in 2001. From there, the number fell and then flattened off to remain stable from 2002 to 2004 (280 million passengers).
Regarding the percentages of trains that were on time, the diagram suggests that there were a lot of fluctuations. The proportion was 92% in 1995 and then declined to 86% in 1997 before returning to the original point just in the following year. An almost similar pattern can be seen between 1999 and 2002. And finally, there was a sharp decrease at the end of the given period, as one in every four trains failed to depart on schedule.
Report