Graph Writing # 61 - Changes in modes of travel in England between 1985 and 2000
- Details
- Last Updated: Friday, 29 July 2022 18:16
- Written by IELTS Mentor
- Hits: 298091
IELTS Academic Writing Task 1/ Graph Writing - Table:
» You should spend about 20 minutes on this task.
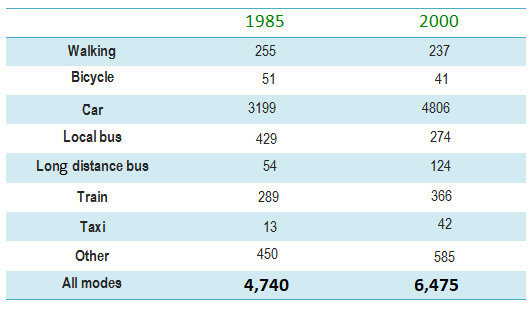
The table below gives information about changes in modes of travel in England between 1985 and 2000.
Summarise the information by selecting and reporting the main features, and make comparisons where relevant.
» Write at least 150 words.
Average distance in miles travelled per person per year, by mode of travel
Model Answer 1:
The table data delineates how the vehicle preferences of British citizens changed over time by comparing the average distance an English travelled using different modes of carriers in 1985 and 2000.
Overall, cars were British citizens' primary mode of transportation and taxi was the least used mode of travel for them in the given time period.
As the data suggests, an English travelled more than 6,400 miles on average in 2000 which was almost 36% higher than the distance travelled in 1985. Car use predominated this total travel as more than 4,800 miles out of 6,400 in 2000 were crossed using automobiles and a similar trend could be observed in 1985. The use of personal cars, in truth, increased over time. Reliance on buses was higher than on train and bicycle use. Despite an average of 255 miles walking by a Brit in 1985, it decreased after 15 years.
Moreover, the taxi was perhaps the least preferred mode of commuting as only 13 miles were travelled by British using it in 1985, which, despite an increase in 2000, was below 50 miles. Train travel hiked in 2000 while distance travelled by British in local buses dropped. All other transportations contributed to 585 miles of travel by a Brit in 2000, an increase than that of 1985.
Model Answer 2:
The table data outlines transportation preferences by British commuters between 1985 and 2000. As is obvious, cars were the most common means of transport in the two mentioned years in the UK.
Interestingly, the British did not use taxis quite often back in 1985, only 13 miles per year was cut by every citizen which made the taxi the least common mode of transportation this year. However, this number increased to 42 miles per person in 2000. On the other hand, bicycles were one of the least used vehicles in 2000 covering only 41 passenger miles. It is clear that cars were still on top of preference among commuters, increasing from around 3000 miles in 1985 to over 4800 miles in 2000. Walking habits remained almost the same for the British while the use of local buses declined. Each passenger travelled around 290 miles per year in trains and that rose slightly after 15 years. The overall distance travelled by the English citizens went up from 4,740 to 6,475 miles in 15 years, and the car was the primary means of transportation for them.
[Author - Malaa]
Sample Answer 3:
The table data shows information about the type of transportation used by the British between 1985 and 2000. As is presented in the table, using the car was the most common way of travelling by English both in 1985 and 2000.
In 1985, more than 3,000 miles were travelled by an average British using cars. It increased to well over 4,500 in the year 2000. The second most common way of travelling was the local bus which was far less commonly used than that cars. Over time, the use of local buses decreased, becoming just over 250 from an initial 429 miles. The taxi was the least preferred transport both years amounting to only 13 miles and 42 miles per person in these two years.
The bicycle was used for an average of 50 miles travel by each person in 1985 and that decreased to 41 miles in 2000 which show the decline of bicycle usages by British. Train and local distance buses were two other modes of transport used by the British, and their popularity increased over time. In 1985, 255 miles were travelled by a British citizen on foot while this distance decreased slightly in 2000. All other transportations used comprised about 450 miles per person in 1985 which increased to 585 in 2000. Finally, a British travelled around 4700 miles in 1985 which rose to over 6400 miles after 15 years.
Sample Answer 4:
The table illustrates how the mode of travel changed in England between 1985 and 2000. Generally, compared to 1985, English travelled more in 2000, and they heavily relied on private cars for commuting.
Cars were by far the most popular modes of transport in both years in England. In 1985, the average distance travelled by English in a car was 3,199 miles, and 4806 miles in 2000. On the other hand, we can see that taxi was the least popular vehicle. Although the travelling distance in 2000 using taxi was above three times than that of 1985, only 42 miles were travelled per person this year, which was almost the same for the bicycle rides. No significant changes happened to some modes of travel, like walking and bicycle between 1985 and 2000.
According to the table, in 2000 local bus was used less than that of 1985. Only 274 miles were travelled in 2000 by buses, which was 55 miles fewer than that of 1985. In contrast, the long-distance bus became more popular over time. Each person travelled 124 miles by long-distance buses in 2000 while only 54 miles in 1985.
In summary, English people travelled more distance in 2000 than in 1985. It is obvious that cars were the most popular mode of travelling.
[ Written by - Wang Zhe, Veta ]
Useful Vocabularies and Phrases for Graph Writing
Recent IELTS Graph samples with answers

Overall, the Brits have travelled a lot more since 1985 with a rise of 1735 miles in 2000. While most of the modes of transportation saw a rise in their mileage, traveling forms like walking, cycling and going by local bus reduced.
As shown in the table, the car was the most used transport to get around at all time. In 1985, it was estimated that a driver, on average, covered 3199 miles, and it rose to 4806 miles 15 years later, an increase of 1060 miles. Other popular transports, namely train and other transports enjoyed the rise in service while people used to roam the roads on their feet and the bus back in 1985, some opted for other transportations , causing the fall in those ways of getting around. Notably, long distance bus and taxi had multiplied their distance use since 1985. By contrast, less distance was covered using cycles in 2000 than in 1985.
In 1985, an average English person drove 3,199 miles in private cars throughout the year, which accounted for around 80% for total distance travelled. The second most popular transport type was the local bus, standing at 429 miles of travel by an average English. Regarding bicycle and local distance bus, the figures for distance covered throughout the year were almost similar, both were over 50 miles.
It is worth noticing that in 2000, train gained more popularity while the opposite trend can be seen when it came to travelling on foot. In detail, walking distance reduced from 255 to 237 miles after 15 years, but the figure for train travel surged to 366 miles. Throughout the given period, travel by taxi increased more than three times to 42 miles all the year and was similar to that by bike. The popularity of cars, as well as local distance buses, increased while that of local bus reduced.
As for other means of transport, they accounted for roughly one-tenth in 1985 and one-eleventh in 2000. All in all, the total distance for all modes of travel rose from 4,740 miles to 6,475 miles by the end of the given 15-year period.
The table data gives information about modes of travel in England and the average distance in miles travelled per person per year, between 1985 and 2000.
Overall, the distance travelled on foot, by bicycle and by local buses declined over this period, whereas the rest of travelling mode increased. Using the car is obviously by far the most popular mode of travel in both years.
Firstly let us talk about means of transport that are less used in 2000. The average distance walked and travelled by bicycle fell slightly, from 255 to 237 and 51 to 41 miles per person respectively. The use of local buses also decreased dramatically, from 429 to 275 miles per person.
However, long-distance buses took more places in British people lives, with a significant increase from 54 to 124. The average distance travelled by train, taxi and car shot also up from 289 to 366, 13 to 42 and 3199 to 4806 respectively. It goes without saying that there are also other means of travelling, like planes, that grew from 450 to 585 miles per person.
Report