Vocabulary For Academic IELTS Writing Task 1 (part 4)
- Details
- Last Updated: Monday, 14 April 2025 11:15
- Written by IELTS Mentor
- Hits: 298174
IELTS Writing Task 1 Vocabulary Part 4:
Graph Writing Vocabulary Index:
Part 1 | Part 2 | Part 3 | Part 4 | Part 5 |
You will often need to use 'adjectives' and 'adverbs' to indicate the speed of changes in the trend (called 'Degree of Speed) in your answer. Following is a list of vocabularies that will help you present the quick changes quite effectively.
Adjectives:
» Rapid, Quick, Sharp, Swift, Sudden, Wild.
» Steady, Gradual, Moderate
» Slow, Gentle.
Adverbs:
» Rapidly, Quickly, Sharply, Swiftly, Suddenly, Wildly.
» Steadily, Gradually, Moderately
» Slowly, Gently.
A different set of vocabulary to represent the 'Degree of Trend' would also be handy to summarise data presented in a graph. Both 'adjective' and 'adverb' form of this vocabulary list is given below. Use 'adjectives' to modify a 'Noun', while 'adverbs' should be used to modify a 'verb'.
Adjectives:
» Significant, Huge, Enormous, Steep, Substantial, Considerable, Marked, Dramatic, Abrupt.
» Moderate, Slight.
» Minimum (singular), Minima (plural)
Adverbs:
» Significantly, Hugely, Enormously, Steeply, Substantially, Considerably, Markedly, Dramatically, Abruptly.
» Moderately, Slightly.
» Minimally
Vocabulary to describe a Map:
IELTS Map Example 1:
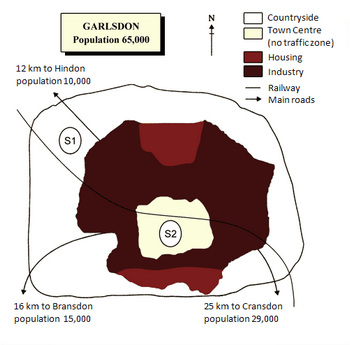
The map below is of the town of Garlsdon. A new supermarket (S) is planned for the town. The map shows two possible sites for the supermarket.
Summarise the information by selecting and reporting the main features, and make comparisons where relevant.
IELTS Map Example 2:
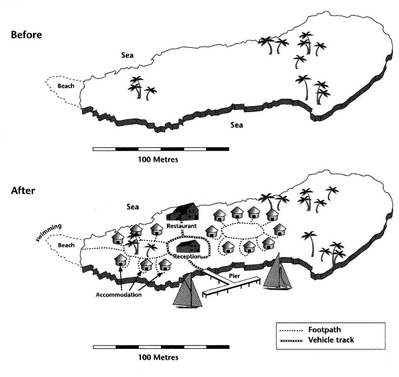
The two maps below show an island, before and after the construction of some tourist facilities.
Summarise the information by selecting and reporting the main features, and make comparisons where relevant.
» Horizontal, Vertical.
» Circle, Square, Rectangle.
» Across, Across from.
» Under, Over, Inside, Beside, On top of, Adjacent, Opposite, Next to.
» Along, Through, As far as.
» Midpoint, Halfway, In the middle.
» Intersection, Overlapping.
» Exterior.
» Parallel to, Parallel, Perpendicular to.
» Edge, Diagonal.
» In front of the, Behind the.
» To the right, To the left.
» On the right-hand side, On the left-hand side.
» North, South, East, West.
» Northern, Southern, Eastern, Western.
» To the north, To the East...
» Where.
» In which, To which, From which.
» Built, Erected, Replaced.
» Situated, Located.
» Changed to/ Converted/ Gave way to/ Became.
» While in 2001, it was ......, later, it was converted to ......
Vocabulary to describe a Process Diagram:
In Introduction:
The diagram/ picture/ flow chart depicts/ illustrates/ describes the proces of/ how....
While Describing the Process:
A) First/ Firstly, Second/ Secondly, Third/Thirdly ...... Next/ After that/ Then, Following that/Followed by, Subsequently/ Subsequent to that, Finally/ Lastly...
B) Where/ From where/ After which/ After that/ Afterward...
C) When/ As soon as/ Immediately, Just after that...
D) At the beginning, In the end, Just after the beginning, Just before the end...
To denote the end of a step:
A) After this step/ stage/ process...
B) Once this stage/ step is completed...
To donate what a Step involves:
A) The phase/ step/ stage involved...
To denote the repetition of a cycle/ process:
A) The cycle/ process then repeats itself.
B) The cycle/ process is then repeated.
Vocabulary to describe Predictions:
Some graphs and diagrams not only list down the data that represent something from the past or the present time but also gives a prediction of the future. For instance, a line graph might present the population of a country from 1950 to 2050, over a hundred years. If you are taking the IELTS exam in 2025, you need to describe the population of this country till 2024 using the past tense. For the population figure in 2025, you will use the present tense. Finally, the population from 2025 till 2050 is a prediction and hence you should be using the future tense while describing it in your writing.
Moreover, you need to use certain vocabularies to represent such future data/ predictions. Following is a list of such vocabularies to help you accurately describe any predicted data:
It is predicted/ estimated/ projected/ forecasted/ expected/ anticipated that ......... will ...........
Is /are predicted/ estimated/ projected/ forecasted/ expected/ anticipated to ............
It gives prediction/ estimation/ projection/ forecast of ..........
It ...... will .........
....... Will have ....... by ....... (year/month/decade) .......
Vocabulary to show the value/ Incorporate data/ figure:
You should not write down every piece of data/figure that is given in the diagram in your report writing and doing so would actually hurt your band score. You are expected to mainly show the following in your report writing: --
- Comparison of data/trend
- The contrast of data/trend
- Most significant figures/data/information/ trend (typically 4-6)
- The highest point
- The lowest point
- The overall scenario.
However, to compare/contrast data or to show a significant change/trend you will need to show a figure that you will use as the base. For example, The British spent over eighty thousand Pounds on average which was twice the spending of Americans and approximately quadruple than that of the Irish. Here, over 80 thousand pounds is the base figure.
Following is a list of vocabulary to use to show such figures in your report writing:
Is/ was/ were: The percentage of foreign students was exactly ten in 2001 at this university and it rose three times in ten years.
Stand at/ Stood at: The percentages of males and females who opined that they should be allowed to get married at 21 stood at 14 and 16 in 1990 but witnessed a noticeable decline in 2010.
Exactly & As high as: The sale in March was exactly 400 and went up as high as 1100 in June.
Using (): In summer, the number of refrigerators sold (154) was far greater than the refrigerators sold (63) in winter.
Which:
1. From January to March the death case rose three times which was only 23 between October and December.
2. The temperature, which was 21 degrees C in March, climbed to 39 degrees C in mid-July.
Makes up: In the first decade, the population remained steady, which made up 2.8 million approximately, but it doubled in the next 30 years.
Constitutes: The initial expenditure, which constituted 280 USD, climbed rapidly and reached its peak during 2014.
Accounts for:
1. In June 2016. the number of Asian students enrolment in this university accounted for 45 which is estimated to be almost double in the next year.
2. The number of infected people, which accounts for nine, is markedly lower than the number of infected patients in the last month, which accounted for forty.
Vocabulary to write the Conclusion part:
To draw the conclusion: In conclusion / To conclude / On the whole.
To Summarize: In short / In brief / To sum up / In summary.
However, according to some teachers and examiners, a more appropriate way of drawing the conclusion of your graph writing should start with the words/ phrases:
Generally,
Generally speaking,
All in all,
From the graphs, it is quite evident that.
Examples:
1. In conclusion, third world countries have improved their production sectors like garments, over the last 10 years whereas the first world countries have improved their technology and research sectors during the same period.
2. In brief, the overall sale of the company has improved in the last 5 years except 2005 when the sale reduced significantly due to retrenchment.
3. All in all, the process of building an IC is a complex one and involves more than eight steps to complete including the testing phase.
4. It is quite evident that women employment progressed remarkably in the last decade and in some employment sectors women are well ahead of men.
5. To conclude, weather forecasting is a complex process and a great deal of technology is used to prepare and broadcast reliable weather forecasting.
Tip: "In a nutshell" is not a formal expression and this is why you should not use it in your IELTS Writing.

« Graph Writing Vocabulary (Part 3) Graph Writing Vocabulary (Part 5) »

Report