Graph Writing # 116 - Global population figures and figures for urban populations in different world regions
- Details
- Last Updated: Tuesday, 28 July 2020 12:34
- Written by IELTS Mentor
- Hits: 121928
IELTS Academic Writing Task 1/ Graph Writing - Line Graph + Column Graph:
» You should spend about 20 minutes on this task.
The graphs below provide information on global population figures and figures for urban populations in different world regions.
Summarise the information by selecting and reporting the main features, and make comparisons where relevant.
» Write at least 150 words.
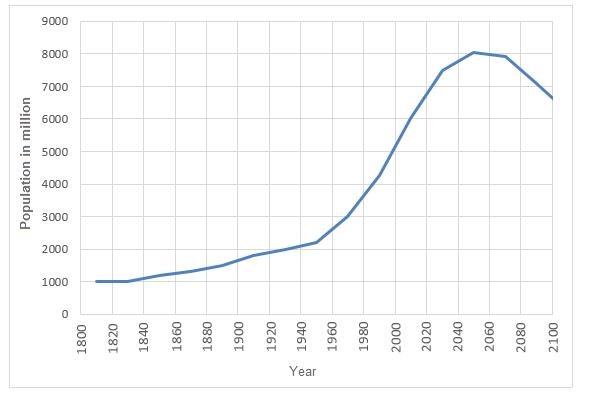
World Population Growth 1800 - 2100
Sample Answer 1:
The given illustrations show information on the world population from 1800 to 2100 (with projection) and show the distribution of this population in developed and developing regions.
According to the first graph, from 1800 to 1920, the global population was less than 2000 million with a slight increase. But after 1940, this population boomed and reached to 6000 million in the year 2000. The graph shows the projection that this rapid growth o population would continue till 2050 when the population would reach to over 8000 million. But after that, the global population will decrease and will fall to around 6000 million in the year 2100 according to the projection.
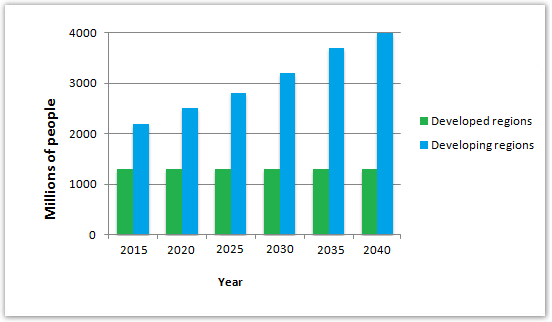
According to the second graph, around 1200 million people lived in the developed regions in 2015 and the population in this part would remain almost the same till 2040. On the contrary, the population of the developing country will keep increasing and would reach to 4000 million in 2040 compared to the initial population of 2100 million in 2015.
In summary, the global population will keep on increasing till 2050 and this increase would be more on developing regions than the developed regions. After 2050, it is projected that the total population of the world will be decreasing.
Sample Answer 2:
The provided illustrations show information on the world population from 1800 to 2100 and the distribution of this population in developed and developing regions.
As per the line graph, the global population increased comparatively slowly from 1800 to 1940 and reached over 2000 million in 1940. This was followed by a drastic rise to 6000 million by the year 2000. The graph shows the projection that this rapid growth of population will continue until 2050 when the population would be over 8000 million. However, after that, it would fall to around 6000 million in 2100. According to the bar graph, around 1200 million people lived in developed countries in 2015 and this figure would remain unaffected until 2050. On the contrary, over 2000 million lived in developing countries in 2015 and the population in these areas are expected to be double by the year 2040.
Overall, the global population would continue to rise until 2050 and the majority of the people would be living in developing regions while the population in the developed countries will remain almost the same.
[Written by - Tintu]

Generally speaking, the global population soared over the period and is predicted to reach its peak in almost 2050 before it drops till the end of the period. Additionally, Although the developed countries are expected to maintain the same number of populations until the year 2040, the developing countries population will upsurge.
To begin with the line graph, the growth in the census was quite slow from 1000 million to almost 1800 million during 1800 AD to 1880 AD. However, between 1900 and 2000, the numbers have surged to 5000 million. Moreover, the growth is predicted to reach its peak point by 2050, recording 8000 million, before it slips down to just below 7000 by the year 2100.
Regarding the bar graph, it is clearly seen that the developed countries will maintain a constant population, around 1200 million. However, the developing countries will trend up to nearly four times that value.
Overall, the world population skyrocketed and is expected to grow more rapidly in the future and majority of the world city population live in developed countries. I
n the beginning of the 19th century, the global population was 1,000 million and it doubled in 1920. In the next 4 decades, the world population remarkably grew to 3,000 million and the population reached 6,000 million in just 40 years. This population is predicted to skyrocket and reach to more than 8,000 million by 2040 to 2060.
According to the bar chart, a large proportion of people in developed countries live in cities while this ratio will greatly increase in the coming ages. In 2015, over 3 thousand million people in advanced countries were city-dwellers while this was almost half in developing countries. In 2040, it is forecasted that developed countries will have 4 thousand million city living people which would be approximately four times higher than that of developing nations.
Report