Graph Writing # 119 - Radio and television audiences of United Kingdom throughout the day
- Details
- Last Updated: Tuesday, 28 July 2020 12:34
- Written by IELTS Mentor
- Hits: 127393
IELTS Academic Writing Task 1/ Graph Writing - Line Graph:
» You should spend about 20 minutes on this task.
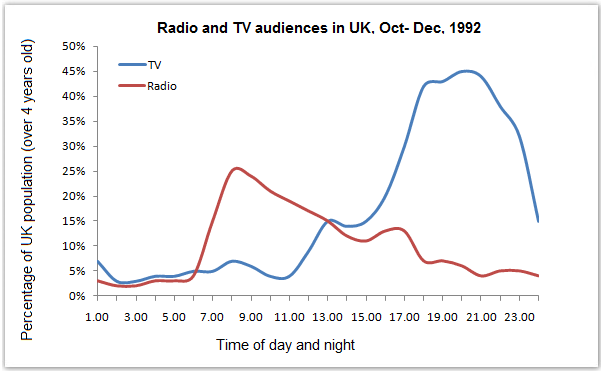
The graph below shows radio and television audiences of United Kingdom throughout the day in the year 1992.
Write a report for a university lecturer describing the information shown below.
» Write at least 150 words.
Sample Answer 1:
The supplied line graph shows data on the radio and TV audiences of UK throughout a day of October- Dec in the year 1992. As is presented in the graph, people listen to radio from 5:30 am to 1:00 pm more than they watch TV while they prefer to watch television programs from 1:00 pm to 11:00 pm more than they listen to the radio.
According to the line graph, only around 5% people who are over 4 years old listened to the radio or watched TV programs at 1:00 am at night. This percentage remained almost unchanged till 5:30 am next day and after that, the radio audiences increased remarkably and reached to around 25% at around 9:00 am. During this time very few people watched TV amounting on an average 5% of total population. After 9:00 in the morning, the radio listeners’ percentage kept on decreasing and reached to 5% at 7:00 in the evening and remained at this level till the next day morning. On the other hand, the TV viewers’ percentage increased after 2:30 pm and reached to 45% at around 9:30 pm at night.
In summary, almost half of the UK people watch TV from 5:30 pm to 9:30 pm while 25% people from the UK listened to radio from 5:30 am till 1:00 pm.
(Approximately 217 words)
Sample Answer 2:
The provided line graph gives information about the percentage of the population watched TV or listened to the radio during the day-time or night-time. This study has been realised among the UK population from October to December 1992.
If we first glance at the graph, we can observe that 7% of the UK population started listening to radio from 6:00 am in the morning whereas nobody watched TV at this time of day. The radio audiences gradually increased to reach a peak of 26% of people at 8.30 am. Then, this trend went step by step down to about 4% of the audiences at 6 pm. We can truly affirm that people listened to radio mostly before heading to work or on the way to their workplace. However, regarding TV audiences the time period where people were watching it the most is obviously between 6.00 pm to 10.00 pm with the highest point reaching 45% at 8.00 pm.
To sum up, the UK population were more active listening to the radio in the early morning before going to work while they were active on watching TV in the afternoon once they got back from work to before they went to sleep.
(Approximately 196 words | Written by Dhuicq Justine)

Report