Graph Writing # 18 - Employment rates across 6 countries in 1995 and 2005
- Details
- Last Updated: Tuesday, 30 November 2021 18:00
- Written by IELTS Mentor
- Hits: 198735
IELTS Academic Writing Task 1/ Graph Writing - Column Graph:
» You should take 20 minutes to complete this task.
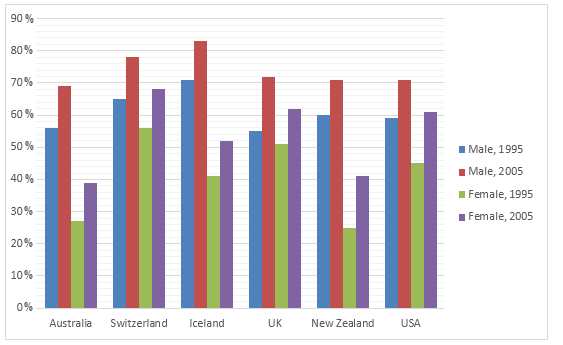
The graph below shows information on employment rates across 6 countries in 1995 and 2005.
Summarise the information by choosing and describe the main idea, and make comparisons where appropriate.
» Write at least 150 words.
Employment Rates by Country, 1995-2005
Model Answer 1:
The supplied bar graph compares the employment rates between men and female in 6 different countries for the years 1995 and 2005. As is observed from the given data, the employment rate among men was higher than that of females in all of the given six countries and the overall employment conditions in Iceland, Switzerland was comparatively better than the other four countries.
As is given in the diagram, initially in 1995, more than 65% males were employed in Switzerland and in Iceland while in other four countries this rate was less than 60%. After a decade, the male employment percentage reached over 70% except in Australia. On the contrary, in 1995, the female employment rate was over 50% only in Switzerland and for the rest of the countries, this was from 28% to 58%. This quota also improved over the 10 years, and in 2005, female employee rate reached to almost 70% in Switzerland and for the rest of the countries, it was 50%.
In summary, the male had a better employment record than the female and in 10 years the employment opportunity for both male and female increased.
Sample Answer 2:
The column graph shows employment rate variations in six countries, namely, Australia, Switzerland, Ireland, UK, New Zealand and the USA between 1995 and 2005. As is observed, employment rates in these countries improved and there have been notable advancements for women in the workforce.
It is obvious that women had lower employment rates in most of the countries. For example, in Australia in 1995, 57 percent of men had a job, but only 27 percent of women were employed. In this year, the highest employment rates for women (70%) was in Iceland where more than 80% men were working class.
The second biggest trend in the graph is the improvement in employment between 1995 and 2005. In all countries shown, figures for both men and women employment rates improved. The biggest change was in the United Kingdom, from 55 percent of men in 1995 to 73 percent over the ten years period. Furthermore, the increases in employment rates for women were much higher in New Zealand. The percentage of working women jumped from 25 percent to 42 percent, and in the United States from 45 percent to 61 percent over the decade. In these countries, at least a 12 percent increased both for men and women over the ten years.
Sample Answer 3:
The supplied bar chart compares the employment rate among men and women workers in 1995 and 2005 in six countries across the globe. It is clear that in 1995, the employment rates in Iceland and Switzerland were comparatively higher than other countries and more men were employed than that of women in the given countries.
Male employment rates in Switzerland and Iceland was over 65% while it was exactly 60% in New Zealand in 1995. In this year about 58% Australian male was employed while in the USA it was just below 60%. Finally, in the UK about 55% males were employed. On the other side, women employment rate in this year was comparatively lower (only 27-28%) in Australia and New Zealand. Women in Switzerland had the highest employment rate in this year which was approximately 58%.
After 10 years, the employment rate, both for woman and men, increased and the highest employment rate for men could be observed in Iceland (82%) and lowest in Australia (69%). Similarly, the highest women employment rate was in Switzerland (68%) and lowest in Australia (38%). Though the percentage of women employment increased in 2005, men were still ahead of women in employment sectors in these six countries.
[Written by - Basil Alias]
IELTS Graph Question: The chart below shows information on employment rates across 6 countries for men and women in 1995 and 2005.
Model Answer 4:
The bar chart shows how the employment rates in six countries changed both for males and females between 1995 and 2005. Overall, male employment ratio was higher than that of females but women progressed a lot during the given period.
As the diagram suggests, Icelander males had the highest employment ratio both in 1995 and 2005, about 70% and 82% respectively. Women, however, in Iceland had a less impressive job ratio. Only 40% in 1995 and just over 50% in 2005. A similar employment ratio for men could be observed in Switzerland but female engagement in work in Switzerland was far better than any other country. Almost seven out of ten females in Switzerland had a job in 2005 compared to around 40% female job holders in Australia and New Zealand in this year.
The USA and UK had an almost similar employment rate both in this year and 70% males and 60% females in these two countries were doing some kind of job in 2005. Interestingly the largest gap between female and male employee ratios could be observed in Iceland, Australia and New Zealand despite their noticeably higher male employment rates.
What is the Graph about?
» The column graph compares employment rates both for men and women in six countries - Australia, Switzerland, Iceland, the UK, New Zealand and the USA.
» It shows the employment rates of both genders in 1995 and 2005.
» It compares employment rates of men and women in 1995. It also compares how the employment rate changed after a decade.
» It shows which countries had better employment rates.
» It shows the gap between the employment rates between male and female.
Summary of the Graph:
The column/bar graph compares the employment rates in six countries both for males and females in 1995 with that of 2005 in six countries. It is evident that employment rates for males were between 55% and 70% in 1995 while it was between 28% and 57% for women. The highest percentages of male employees were in Iceland and Switzerland and British, American and Swiss females were higher in ratio than that of other countries in terms of having a job. The employment ratio among citizens of the given countries improves in a decade and more employment among females improved significantly in 10 years.
Useful Vocabularies and Phrases for Graph Writing
Recent IELTS Graph samples with answers

From the stats provided, we can understand that employment conditions improved in 2005 as compared to 1995. Moreover, male employment percentages in those countries were higher than women employment.
In detail, about 55% of males were employed in Australia in 1995 which rose to about 70% a decade later. In this country, just below 30% of females had jobs in 1995 which increased by 10 to 11 per cent in ten years. Among those countries, Iceland's employment situation for males was the best. This country was in the top position in providing better job facilities to men (almost 85% in 2005). Contrary to that, it was the best for women in Switzerland, where over 50% of women were employed in 2005. In the UK, New Zealand and the USA, the male employment percentage stood around 70% in 2005 and among these three countries, NewZealand had the least ratio of female employees- which was approximately 25% whereas it was slightly over 50% in the UK and 45% in the USA.
Overall, regardless of gender, the employment rates increased over a period of ten years. Interestingly, the male population exceeded their female counterpart back in 1995 when it came to their employment percentage, and that trend remained almost the same after ten years in all six countries mentioned.
In further details, among the male population back in 1995, only the male in Iceland managed to reach 70% employment rates. However, the percentages of employment among men in Australia, Switzerland, New Zealand and the USA were also close to it, and no country had a male employment rate below 50%. For the women, on the other hand, Switzerland was the sole country to reach a little higher than 50% employment rate, while the UK managed to be at exactly 50%. With New Zealand, having the least percentage at only slightly above 20% at that time, which was just a little bit lower than Australian women's employment rate.
After a decade, Iceland still claimed the highest percentage of jobs among men as it managed to cross more than 80% mark. And just like the trend 10 years ago, the other 5 countries were not much behind, especially Switzerland, that reaching almost 80% when it came to male employment. The case was almost the same among women, as Switzerland got the highest percentage as it almost reached 70% female job rate. While Australia and New Zealand had been consistent to be the two countries with the lowest employment rate among women, but this time, New Zealand surpassed Australia which was around 40%.
Report