Graph Writing # 29 - Food budget average Australian family spent on restaurant
- Details
- Last Updated: Saturday, 18 July 2020 22:09
- Written by IELTS Mentor
- Hits: 58093
IELTS Academic Writing Task 1/ Graph Writing - Pie Chart + Line Graph:
» You should spend about 20 minutes on this task.
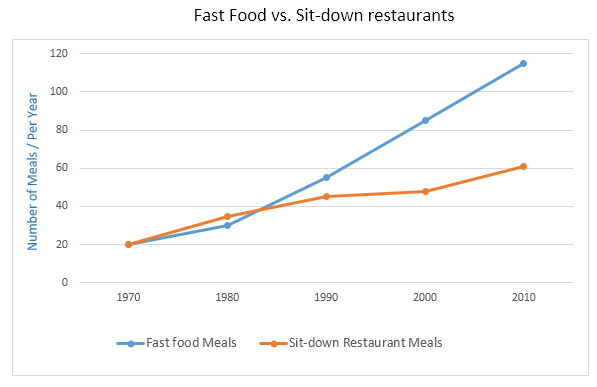
The charts below show the percentage of food budget the average Australian family spent on restaurant meals in different years. The graph shows the number of meals eaten in fast food restaurants and sit-down restaurants.
Summarise the information by selecting and reporting the main features, and make comparisons where relevant.
» You should write at least 150 words.

Sample Answer 1:
The pie chart and line graphs reveal that average Australian families during 1980 to 2010 took more interests in restaurant meals and fast food meals became quite popular among them.
Analysing the data presented in the pie charts reveals that an average Australian family spent only 15% of their food budget on outside food while the remaining 85% was spent on preparing food at home. Over the period, Australians started spending more on restaurant meals and started spending half of their budget on outside food just in 20 years. In 2010, they spend 60% of their food budget on bistro foods and that was a quadruple increase just in 30 years.
Based on the line graph, Australians ate 20 meals both in a fast food shop and in a sit-down restaurant in 1970 and this number gradually increased in the next 20 years when the fast food became more popular in terms of the number of meals eaten by an average Australian in a year. The gap between the fast food and restaurant meal eating increased dramatically and in 2010 more than 110 meals were eaten in a fast food shop while this number was just above 60 in the case of sit-down restaurants.
Model Answer 2:
The pie charts elucidate the ratio of food budget average Australian families spent for preparing foods at home and for dining in eateries in four decades. The line graph outlines the number of meals these Australian families ate in two types of restaurants between 1970 and 2010. As is observed, Australians’ budget for outdoor meals increased overwhelmingly over the decades and fast food meals were more popular than that of sit-down restaurants among them.
The data suggest that preparing food at home in Australia was the main trend in 1980 and only 15% food fund were spent to dine outside but the spending ratio to have restaurant meals increased to 35% next decades. In 2000, average Australians spent exactly half of their food budget to eat at bistros. Interestingly they spend sixth-tenth of their budget to enjoy restaurant foods in 2010 which was exactly four times higher than that of 1980.
The table data indicates that an Australian ate around 40 restaurant meals in 1970 of which 20 was fast food meals. Over the period, people started having more restaurant meals and fast food became highly popular with almost 120 intakes in 2010 against just over 60 sit-down restaurant meals.

Report