Graph Writing # 49 - Transport used to travel to and from work in European city
- Details
- Last Updated: Monday, 20 July 2020 16:12
- Written by IELTS Mentor
- Hits: 176733
IELTS Academic Writing Task 1/ Graph Writing - Line Graph:
» You should spend about 20 minutes on this task.
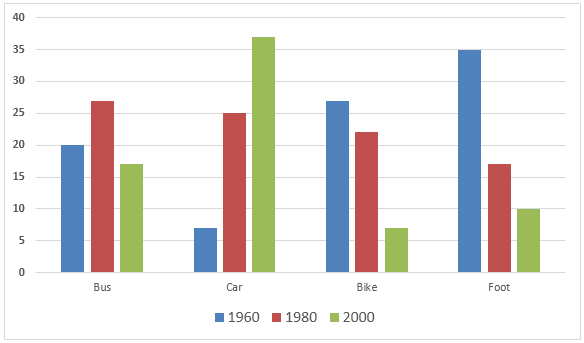
The graph below shows the different modes of transport used to travel to and from work in one European city in 1960, 1980 and 2000.
Write a report for a university lecturer describing the information below.
» You should write at least 150 words.
[Figure: Transportation used in Percentages.]
Sample Answer 1:
The column graph represents information on travellers’ commuting preference to reach office and return home in a European city in three different years- 1960, 1980 and 2000. overall, the car gained its popularity and the number of people who used to walk gradually decreased.
In 1960, almost 20 percent people used buses to and from workplaces and this percentage grew to almost 28% after 20 years. In 2000, bus users fell to less than 20%. On the contrary, in the case of private cars, the users were only about 7% in 1960, which was the lowest among the 4 categories, and this increased sharply in 1980 amounting 25%, and in 2000, more than 38%, making it the most used form of the transportation system.
Besides, more than 27% people used bikes in 1960 and in 1980 the number decreased by 5% but in 2000 it dramatically fell to somewhat 7%. Finally, 35% people used to walk to go to work and to return from there. But this foot-walkers' number declined significantly in the 80s and in 2000 one out of ten office goers walked.
To summarise, more people used to walk to travel to and from workplaces in 1960 but with the popularity of private cars, this ratio declined.
Model Answer 2:
The bar graph gives data on different transportation systems that people used in a European city in three decades- 1960, 1980 and 2000 and also compares how the habit of going to work and returning home had changed over the 40 years period. Overall, with the widespread use of cars, peoples' habit of using bikes and walking reduced noticeably.
Initially, in 1960, lots of people used to commute either on foot or by a bike, 35% and roughly 27% consecutively compared to only about 7% private cars and about 20% bus usage. After 20 years, the number of car and bus users soared noticeably to 25% and to nearly 28%. The car users grew more than 3 times over 20 years and in the same year, people travelling on foot fell to less than half as it was in 1960. In 2000, only 10% work-goers walked, only about 7% people rode a bicycle compared to 18% bus users and about 38% private car users.
In 1960, the majority of the people travelled to and from work on foot or using a car but the scenario became completely different after 40 years when most of the people used cars or buses.
( This model answer can be followed as an example of a very good answer. However, please note that this is just one example out of many possible approaches.)

Overall, it is clear that the percentage of people who chose to go to work by bus, bike, or walk to work saw a downward trend. However, the opposite was true for cars.
In 1960, walking was chosen by most commuters, with roughly 35% of people going to work on foot, followed by cyclists (about 27%), and the lowest being car users (approximately 7%). However, within two decades, this trend conversely changed when walking was the least preferred (almost 17%), and the proportion of people travelling by bus outnumbered other forms of transport by around 27%, reaching its lowest point of 17% in 2000.
On the contrary, the proportion of car users saw a dramatic growth of 30% from 1960 to 2000, which made cars the most popular choice of transport modes, as opposed to the figures of cyclists and walkers, which had experienced a significant decline to around 7% and 10%, respectively, by 2000.
Report