Graph Writing # 173 - Demographic trends in Scotland
- Details
- Last Updated: Tuesday, 25 August 2020 23:59
- Written by IELTS Mentor
- Hits: 52705
IELTS Academic Writing Task 1/ Graph Writing - Line Graph:
» You are advised to spend about a maximum of 20 minutes on this task.
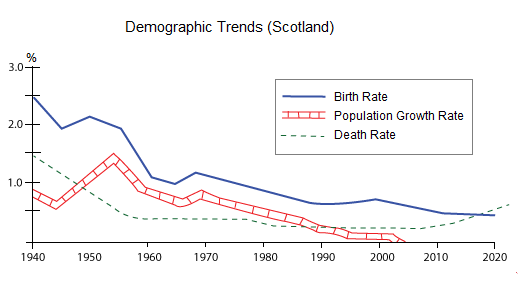
The figure shows demographic trends in Scotland.
Summarise the information by selecting and reporting the main feature.
» You should write at least 150 words.
Sample Answer 1:
The given illustration depicts the changes of demographic trends over seven decades in Scotland and also gives the prediction for the year 2020. The survey has been taken from 1940 to 2010 on three criteria, namely: birth, population growth, and death.
Initially, fertility and mortality have reached their peak in 1940, whiles population growth reached its highest percentage in the second decade. It was about 2.5% birth rate in 1940 and then it declined sharply over five years. After a further decline, it fluctuated roughly twenty years. There was a peak in 2000 after falling gradually from 1960's by roughly 1.0%. It predicted that about 0.5% fertility in 2020.
The chart shows that there is a relationship between fertility and population growth by its trend. The dip, peak, and fluctuation are shown in the same decade, in which, the percentage of population growth always lower. On the other hand, it’s declined sharply and reached to zero growth in 2000's so that could not be predicted for 2020. The death rate went down steadily from 1940 to 1950s and then levelled off till 1970s by roughly 0.5%. After felt slightly in the last 1970s, it remained the same over the following thirty years. However, its number will rise in 2020 by over 0.5%.
In short, the trends of three categories are decreasing over seven decades and only the mortality rate is expected to be increased in 2020.
[ Written by - Nurul Izzah ]
Sample Answer 2:
The given illustration elucidates the nativity, death and population growth rate in Scotland from 1940 and gives projection till the year 2020. Generally speaking, population growth rate in Scotland dropped to almost zero around 2003 and death cases would rise in the future.
As can be seen from the given line graph, natality in Scotland in 1940 stood at 2.5% while mortality was 1.5%. Population growth rate at that time was just below 1% which afterwards increased sharlply till 1955 with a slight drop in early 1940s. The fertility rate showed an overall downward trend with some fluctuations and reached to zero after 2000. On the contrary, mortality rate decreased rapidly till 1960 when it stood at just below 0.5% and after that remained nearly stable till 2010. With regards to growth of population, it reached the peak in 1955 and stood at 1.5% and then kept on decreasing before reaching to nill.
The line graph also predicts that the death cases in Scotland will rise in the future and would intersect the fertility rate in around 2018 when they would stay at just below one percent.
In summary, the demographic statistics depicts that Scotland managed to nullify its population growth in around 2003 while the mortality and fertility rate would stood at the same level in the future.
[Written by - Grace]

Overall, it can be seen that the population growth rate became zero in 2003 while both birth and death rates decreased dramatically till 2015, after which, the death rate started to go up crossing the birth rate.
To begin with, the birth rate in Scotland in 1940 was the highest, standing at 2.5 per cent while the death rate in the same year was 1 per cent less. The birth rate fluctuated mostly in a downward trend, as the figure became exactly 1 per cent twenty-five years later and even dipped to approximately 0.6% in 1990.
As for the death rate, a significant drop can be noticed between 1940 and 1955 before flattening off until 2010. Latter years, the figure was approximately 0.25 per cent, which was half as much as the birth rate, also in the year 2010. Fatality intersects birth rate in 2018, and it started to exceed birth rate from 2020.
Regarding the growth of Scotland's population, it reached the highest point of 1.5% in 1955 before decreasing sharply. After 1960, the figure became less than 1% and stood at just under 0.5% in 1980. 23 years later, it became zero for the first time and remained at that point ever since.
Report