IELTS graph 222 - Potatoes, pasta and rice eaten in a European country
- Details
- Last Updated: Wednesday, 26 August 2020 00:13
- Written by IELTS Mentor
- Hits: 23354
IELTS Academic Writing Task 1/ Graph Writing - Line Graph:
» You should spend about 20 minutes on this task.
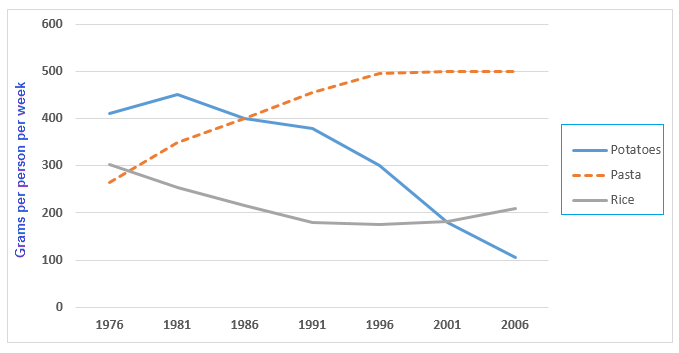
The graph below shows the amount in grams of potatoes, pasta and rice eaten in a European country between 1976 and 2006.
Summarise the information by selecting and reporting the main features and make comparisons where relevant.
Write at least 150 words.
Potatoes, pasta and rice eaten in a European country 1976-2006.
Model Answer 1:
The line graph compares the intake of three food items – potato, pasta and rice in a European country between 1976 and 2006. The unit is given in grams and it represents the consumption by each person in a week. Overall, potato consumption was higher than rice and pasta consumption in the 1970s but after three decades, pasta became the most popular.
Getting back to the details, around 400 grams of potato was consumed by each person in a week in 1976 in this country. At that time, the consumption of rice was exactly 300 grams, which was slightly higher than that of pasta. After ten years, pasta consumption skyrocketed while rice consumption plummeted and potato intake slightly dropped. In 1996, pasta became the highest consumed food at 500 grams while potato intake dropped to around 300 grams and rice below 20 grams. Finally, in 2006, pasta intake stood at 500 grams as it was 10 years earlier while potato eating per person further dipped and reached the nadir at only 100 grams. With a slight increase in potato consumption than 5 years earlier, potato remained as the second most preferred food in this country.
Sample Answer 2:
The line graph presents information on weekly potato, pasta and rice consumption per person in a European country over a period of 30 years, commencing from 1976, measured in grams. Overall, the consumption of potatoes and rice declined over the time while pasta intake increased significantly.
Now getting back to the details, initial consumption of potatoes was over 400 grams per person in a week while it was roughly 300 grams for rice and pasta. The amount of pasta consumption rose gradually from 1976 to 1996 and remained steady to reach the peak in 2006 approximately at 500 grams per person in a week. In contrast, the intake of potatoes showed a fluctuation between 1976 and 1996. Furthermore, potatoes intake reached the nadir about 100 grams per person per week in 2006.
It can be clearly seen that the rice consumption fluctuated from 1976 to 1996 and then the consumption of that dropped moderately. However, from 2001 to 2006 there was a rising of rice consumption in a European country. During the period its consumption dropped from 300 grams to just over 200 grams.
[By - Imam Safrullah]

In detail, the intake of pasta grew from approximately 280 grams per person each week to 500 grams after two decades. Between the years 1996 and 2006, the figure levelled off. It is worth noticing that consumption of potatoes in the final year was just one-fifth compared with that regarding pasta. The potato consumption for an average person was highest in 1981, at about 450 grams per week, but then declined sharply and continually to ultimately become less than one-fourth of its initial figure.
In 1976, rice consumption had been just over 300 grams per person per week, before hitting the lowest point, under 200 grams, after 15 years, The figure remained steady from 1991 to 2001, and finally surpassed 200 grams per week in the year 2006.
Report