IELTS graph 223 - Complaints about the bank of America
- Details
- Last Updated: Wednesday, 26 August 2020 00:13
- Written by IELTS Mentor
- Hits: 81817
IELTS Academic Writing Task 1/ Graph Writing - Pie Chart + Bar Graph:
» You should spend about 20 minutes on this task.
The graphs indicate the source of complaints about the Bank of America and the amount of time it takes to have the complaints resolved.
Summarise the information by selecting and report in the main features, and make comparisons where relevant.
Write at least 150 words.
Sample Answer 1:
The pie chart shows the percentages of complaints made by different entities about the Bank of America while the bar graph depicts the average time required to resolve those objections. Overall, the highest objections came from the mass people while the resolution time for those complaints varies from 4 to 6 months.
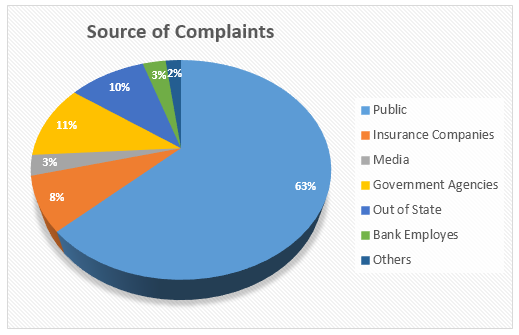
According to the pie chart, the highest percentage of complaints, more than 60%, about the Bank was reported by the public while the second largest of those complaints came from the government agencies, just over 11%. Insurance companies recorded 8% objections and the lowest ratio of those complaints was originated from the bank employees and out of state entities, 3 and 2 percent respectively. Interestingly only 3% complaints were logged by the media and the rest came from other sources.
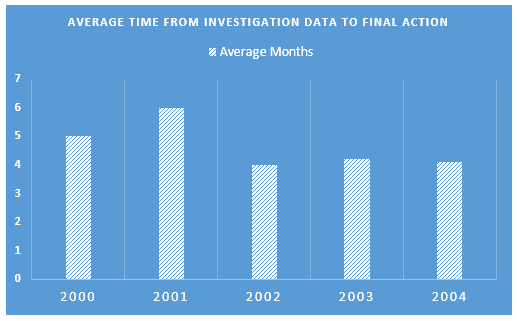
Average resolve time, depicted in the bar graph, reveals that the Bank of America took roughly four to six months to fix those complaints. In 2001 they needed half a year to take actions on those complaints, a month higher than that of previous years. The bank took approximately 4 months in 2002 and 5 months in next two years to provide solutions to the complaints made.
Sample Answer 2:
The graphs provide data on the ratio of objections received by the Bank of America divided into 6 categories (Public, Insurance companies, Media, Government agencies, Out of State, and Bank employees) and the time spent to process those complaints from the beginning to the final act.
Overall, the highest percentage of complaints came from the mass people while the longest time required to process the complaints was six months in 2001. Those complaints were promptly addressed in 2002.
It can be clearly seen from the pie chart that more than 60% complaints to Bank of America were originated from ordinary people. 8% of these were reported by the insurance companies while media complaint ratio was very low, only 3%. Government agency’s complained one out of ten while bank-employers and out of state complaints comprised 5% of it. Complaints from other sources which are not included in the given six categories made up one-tenth of the total complaints.
Now turning to a more detailed analysis in the bar graph, in 2001, 6 months was needed on average to process the complaints and act against those. In addition, all previous and proceeding years displayed an average waiting period of 4 to 5 months.

Overall, it can be noticed that the staggering proportion of complaints were received from the general public while the least volume of complaints recorded was from miscellaneous parties whereas it is clear that bank of America took the longest time in the year 2001 to investigate and give a proper resolution.
According to the pie chart, the majority of complaints reported was from the general public which accounted for 63% - which was well above half of the total complaints received by the bank. The governmental bodies and out of the country (American) customers had a similar number of issues reported to the bank with 11% and 10% respectively. The bank personnel and the media had identical grievance reported which was exactly 3% each followed by miscellaneous entities complaints comprised of the negligible proportion of just 2%. The corporations also had filed complaints against the bank which was 8%.
Now turning to the bar graph, it is quite evident that Bank of America took around 6 months average time in the year to have the complaints resolved. The year 2000 was not far behind in the context of the total turnaround time taken by the bank for the resolvent of complaints which was just below 6 months. In 2003 and 2004, Bank of America had a mirror image of about 4 months to resolve the complaints. Out of all the years, 2002 was the effective year for the Bank as it was able to investigate and take a final action to resolve different issues received just under 4 months which was the lowest required duration in comparison to all the other years.
Report