IELTS graph 307 - Waste recycling rates in the US
- Details
- Last Updated: Saturday, 08 April 2023 04:07
- Written by IELTS Mentor
- Hits: 96610
IELTS Academic Writing Task 1/ Graph Writing - Line Graph:
You should spend about 20 minutes on this task.
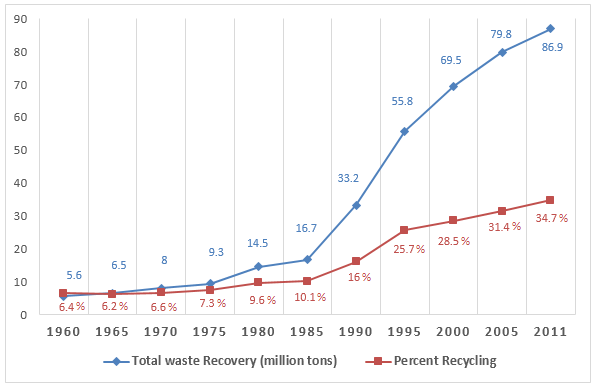
The graph below shows waste recycling rates in the U.S. from 1960 to 2011.
Summarise the information by selecting and reporting the main features, and make comparisons where relevant.
You should write at least 150 words.
National Recycling Rates, US, 1960 to 2011
Model Answer:
The line chart outlines how much waste was recovered and recycled in the US between 1960 and 2011. The garbage recovery is presented in million tons while the recycling is presented in percentages.
Generally speaking, both waste recovery and recycling in the US after 1985 increased remarkably despite the fact that a big proportion of litter remained unrecycled.
As the data suggests, 5.6 million tons of rubbish was recovered in the USA in 1960 and just 6.4% was recycled this year. Recycling in 1965 slightly declined but increased in 1970 when 6.6% of waste recycling took place out of 8 tons. In 1980, more than 14 million tons of garbage were collected and almost 10% was recycled. The recycling rate further developed by almost 2% after 5 years. After a decade, 16% of total waste was recycled and this ratio after that increased steadily and sharply and so did the waste recovery.
Almost one-third of the surplus was recycled in 2005 when waste recovery was nearly 80 million tons, about 8 times higher than that of 25 years earlier. A thorough observation indicates that a great percentage of scrap in the US is not recycled during this time. For instance, out of 80 million tons, only about 32% of waste recycling figure in the US shows that another 50 million tons were not recycled. Finally, in 2011, more than one-third of rubbish was recycled which accounted for around 30 million tons of waste produced in the USA while the remaining 60 million tons were not recycled.

Overall, it can clearly be seen that the rate of national recycling rate showed a sharp increase. Despite the rise, the percentage of total recovery litter rose relatively.
A closer look at the data reveals that initially, in 1960, the recovery waste was 5.6 million while 6.4 per cent of the total waste was recycled. In the following 5 years, it reached 6.5 million whereas the percentage of those declined to 6.2%. Furthermore, the total waste recovery saw a minor rise, in a decade, between 1965 and 1975 whereas in the next 10 years, it witnessed 16.7 million, nevertheless, the percentage of total waste recycling was over a tenth.
This soared sharply since 1985 and reached over half, 55.8 million in 1995. On the other hand, the percentage was approximately a quarter. The numbers continued to increase dramatically from 1985 until the end of the period. As regards the percentage of them, there was an upward trend relatively. A further point of interest is that the percentage of recycled waste represented a slight rise, over 16 years, between 1995 and 2001.
Overall, waste recovery and recycling in the United States grew significantly after 1985 but a large proportion of that litter was not unrecycled.
According to the line graph, 5.6 million tons of rubbish was recovered in the USA in 1960, and just 6.4% of it was recycled. Recycling in 1965 slightly declined but increased in 1970 when 6.6% of waste recycling occurred out of 8 tons. In 1980, more than 14 million tons of garbage were collected, and around one-tenth of it was recycled. The recycling rate further developed by almost 2% after five years. After a decade, 16% of total waste was recycled, and this ratio increased steadily, and so did the waste recovery.
Almost one-third of the surplus wastage was recycled in 2005 when waste recovery was nearly 80 million tons, about 8 times higher than 25 years earlier. A thorough observation indicates that a great percentage of scrap in the US is not recycled during this time. For instance, out of 80 million tons, only about 32% of it was recycled. Finally, in 2011, over one-third of the rubbish was recycled, accounting for around 30 million tons of waste produced.
Report