IELTS graph 318 - Average percentages in typical meals of three types of nutrients
- Details
- Last Updated: Friday, 19 August 2022 22:37
- Written by IELTS Mentor
- Hits: 360086
IELTS Academic Writing Task 1/ Graph Writing - Pie Charts:
You should spend about 20 minutes on this task.
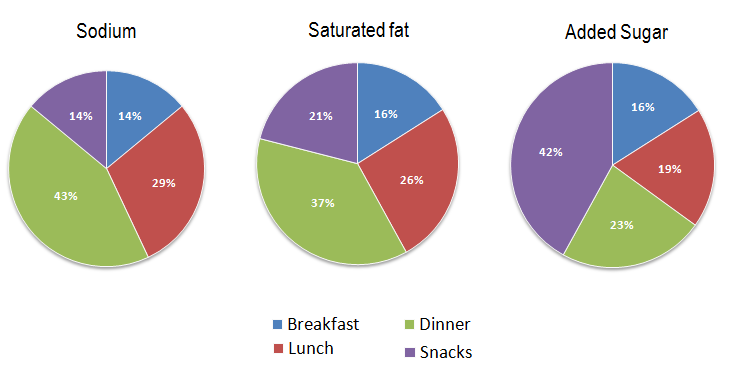
The charts below show the average percentages in typical meals of three types of nutrients, all of which may be unhealthy if eaten too much.
Summarize the information by selecting and reporting the main features, and make comparisons where relevant.
Write at least 150 words.
Average percentages of sodium, saturated fats and added sugars
in typical meals consumed in the USA
Model Answer 1:
The pie charts illustrate the ratio of sodium, saturated fats and added sugar in four average daily meals consumed by Americans. The percentages of these three nutrients in breakfast, lunch, dinner and snacks that American citizens generally consume are given and they are detrimental for health if consumed plenty in quantity.
Overall, dinners and lunches that the USA residents consume are sodium and saturated fats rich while their snacks have a high portion of added sugar.
In details, USA citizens' sodium, sugar and saturated fats intake during the breakfast is comparatively lower, around 14-16% each time. Intake of these nutrients is considerably higher in food items they eat during lunch and dinner. The lunch they eat comprises of 29% sodium, 26% saturated fats and nearly 20% sugar. They consume much higher percentages of these nutrients, which are harmful to health when eaten too much, while they heave their dinner. Their intake of sodium, saturated fats and sugar during dinner are 43%, 37% and 23% respectively. Finally, the snacks they enjoy contain high sugar and fats, 42% and 21%, respectively, and the sugar intake in snacks is higher than that of dinner and lunch.
Sample Answer 2:
The diagram illustrates the proportion of three types of nutrients in typical meals, which can be unhealthy if consumed too much. 'Sodium', 'saturated fats' and 'added sugar' are these three food nutrients and the data is taken from the breakfast, lunch, dinner and snacks Americans eat.
Generally speaking, Americans eat less sodium, saturated fats and sugar during their breakfast but they consume a large proportion of them while they eat their lunch and dinner. The snacks also contain these nutrients in plenty.
The first chart shows the average percentage of sodium intake by Americans. Dinner contains the highest ratio of sodium (43%) while 29% of it is eaten while having lunch. Breakfast and snacks include an equal proportion of sodium, which is 14% each. The second chart outlines the percentages of saturated fats in meals. By eating dinner, average Americans consume 37% of saturated fats, which is the highest among the meal types. Lunch contributes to a consumption of 26% saturated fats, followed by snacks with 21% and breakfast with 16%. The last pie chart illustrates the proportion of added sugar in meals. Snacks contain the highest proportion of it, 42%. A typical dinner includes 23% sugar while lunch and breakfast contain 19% and 16% respectively. It is worth noticing that, these three nutrients are less consumed through breakfasts by Americans.

Overall, it is evident that dinner constitutes the highest percentage of sodium and saturated fat, whereas the largest amount of added sugars is present in snacks. Besides, breakfast contains the lowest proportion of all three nutrients.
The lowest amount of sodium (14 percent) is obtained from breakfast. As is the case for saturated fat and added sugar, the proportion is only 16 percent for both. On the contrary, the highest amount of sodium and saturated fat is offered by dinner (43 and 37 percent, respectively), with only about one-fourth of the added sugar. Snacks take the first place for added sugar, which is exactly double the amount of saturated fat it has, and its sodium content equates to breakfast.
Just above one-fourth of the sodium and saturated fat is offered by lunch. Whereas, it constitutes only nineteen percent of added sugar.
You can also contact me by my email @ happier.aryan@gmail.com. Many thanks in advance.
Overall, the average USA citizen consumes a high amount of nutrients at breakfast, with other meals having better-balanced percentages of nutrients. Dinnertime is when the lowest-nutrient foods are eaten.
Firstly, sodium is consumed the most at breakfast, followed by lunch, being 43% and 29% respectively. Snacks tend to be sweet, so they only represent 14% of sodium consumed. The same goes for dinner. Regarding saturated fat, a similar trend can be appreciated, with breakfast representing more than a third of the fat. The rest two-thirds are mainly lunch, with 26%, followed by snacks, with 21%, and the least rich meal is dinner, with a mere 16%. When it comes to added sugar, the story is different: snacks are the richest, with 42%, while dinner and lunch cover a third of the nutrient and at the 23% left is from breakfast.
Overall, sodium and saturated fat are heavily consumed in dinner whereas the highest percentage of added sugar is consumed in snacks.
Firstly, sodium is taken in small amounts in breakfast and snacks - about 14% in each, whereas, in lunch, its intake doubles up to 29%. However, sodium consumed in dinner is the highest - exactly 43%. On the other hand, saturated fat goes with the same trend as sodium. 21% of saturated fat is present in snacks and 16% in breakfast. In lunch, saturated fat is consumed 26% of total nutrients, but in dinner time, saturated fat is consumed about 37% which is the highest for saturated fat consumption among other typical meals.
Lastly, added sugars are largely taken in snacks about 42% and least in breakfast of 16%. In lunch and dinner, it is at 19% and 23% of total nutrients. Among all the typical meals, a balanced meal is a breakfast for consuming an adequate amount of nutrients.
1:
The given picture illustrates the contribution of every meal to the total daily assumption of sodium, saturated fats and added sugars in the US. At the first glance it is possible to note that while sodium and saturated fats come mainly from Dinner and Lunch, the sugars clearly follow another pattern, with the most substantial intake from snacks.
Starting with sodium, both its main and its second-most common sources, which are respectively dinner at 43% and lunch with just below one third, reach overall highs. The remaining daily need comes equally from the other meals.
Moving on, the saturated fats have similar proportions with the total assumption from Dinner and Lunch at around two thirds, and the remaining split between snacks and breakfast. It is important to note that here the first of the two contributes 5% more than the other, with just below one-quarter of the total.
On the other hand, added sugars in proportion come mainly from the outside-meal food, at 42%. The remaining intake is split with slight differences between dinner, lunch, and breakfast consecutively.
Report