IELTS graph 319 - One country’s exports in various categories during 2015 and 2016
- Details
- Last Updated: Wednesday, 05 July 2023 20:31
- Written by IELTS Mentor
- Hits: 285694
IELTS Academic Writing Task 1/ Graph Writing - Pie Chart + Table Data:
You should spend about 20 minutes on this task.
The chart below shows the value of one country’s exports in various categories during 2015 and 2016. The table shows the percentage change in each category of exports in 2016 compared with 2015.
Summarise the information by selecting and reporting the main features, and make comparisons where relevant.
Write at least 150 words.
Export Earnings (2015 -2016)
Model Answer:
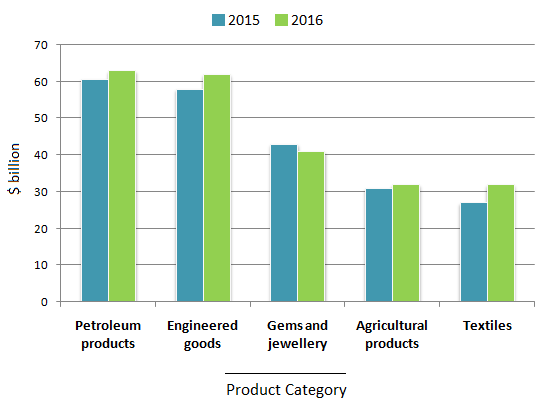
The bar graph compares the export earnings of a country in billions of dollars from five different product categories in 2015 and 2016 while the table data outlines the percentage change in export amount in 2016 than that of the previous year.
Overall, petroleum and engineered products were the main export earners for this country both in 2015 and 2016, and the export amount increased in 2016 than the previous year except for gems and jewellery commodities.
In detail, the country earned approximately 220 billion dollars from its export trades in 2015 which increased by around 10 billion dollars next year. In 2015, earnings from petroleum export were over 60 billion dollars, the highest amount, while engineered goods brought in nearly 58 billion, the second-highest. Next year, they made roughly 63 and 62 billion respectively. Jewellery and agricultural products consisted of 70 billion in 2015 while textile goods secured around 27 billion, which was the lowest. In 2016, the country exported just over 30 billion dollar's textiles and agro merchandise each and nearly 40 billion dollar's jewellery.
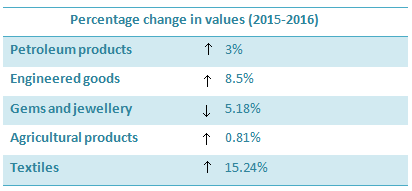
Moreover, in 2016, the value of jewellery products dropped by nearly 5%. Besides, the price of engineered goods soared by 8.5% while the highest increase was for textile products - over 15%. Finally, the price of petroleum and agricultural merchandise in 2016 increased by 3% and approximately 1% respectively than that of the year before.

Overall, most sectors experienced an increase in export earnings, with textiles registering the highest growth. However, the export revenue from the gems and jewellery sector declined during this period.
Petroleum products remained the highest-earning export category, rising from approximately $60 billion in 2015 to just over $62 billion in 2016, reflecting over 2% increase. Similarly, engineered goods showed notable growth, increasing by 5%, from around $57 billion to approximately $62 billion. Agricultural products saw only a marginal rise of 1%, maintaining relatively stable export earnings.
Textiles, on the other hand, experienced the most substantial growth among all categories, with export revenue surging by 6%, from roughly $27 billion to about $32 billion. Conversely, the gems and jewellery sector was the only category to record a decline, with earnings falling by 3%, from nearly $43 billion in 2015 to around $40 billion in 2016.
Our suggestion would be not to use the term "Revenue" as it is not mentioned in the question or the graph.
As is observed in the chart, the country substantially exports petroleum products and engineered goods. Also, growth is seen in most categories.
In detail, the export of petroleum products was over 60 million dollar worth in 2015 and went up to about 63 million in 2016, estimating a 3% value increase. Ranked second, exported engineered goods brought about revenue of approximately 57 million in 2015 and expanded to over 60 million a year later, marking an exponential growth of 8.5 %. By contrast, the export of gems and jewellery decreased. In particular, a drop of 5.18 % was observed in 2016. Agricultural products and textiles accounted for the least exporting incomes, just over 30 million worth in value. However, textiles enjoyed the greatest development of all, drastically increasing since 2015, hitting an expansion of 15.24%.
The petroleum product and engineered good painted a bit similar in patterns where the export figure stood exactly the same at 62 billion in both years although the engineered goods dipped a slightly less of 2 billion than that of petroleum products in 2015. In detail, petroleum products and engineered goods had progressed substantial increment by 3% and 8.5% respectively in 2016 than the previous year. Moreover from year to year, the percentage for the agricultural product was also just a little over 0.81% while textiles made up a tremendous change well above 15%. On the other hand, it was only the gems and jewellery category that witnessed a decrement change of around half of one-tenth in the following year.
Overall, it is noticeable that the exports had accounted for more than 200 billion over the periods consecutively. Interestingly, the exports exceeded by making up as much as 10 billion more in total in the latter year.
Overall, the two main product categories that stood high in export revenues were petroleum products and engineered goods for both the years 2015 and 2016. It can be seen that out of five categories, four have shown a positive gain in revenue except for gems and jewellery.
To elaborate more on the revenue of the country, the net income generated from the five commodities sums up to an amount of approximately 215 billion dollars from its export trade in 2015 and the trade revenue in 2016 rose to approximately 230 billion dollars. In 2015, the earning from petroleum products was up and above 60 billion dollars which was the highest amount, while the engineered goods stood high next to petroleum products with over 55 billion dollars worth of revenue. Next year, these two products helped the country make roughly 63 billion dollars and 62 billion dollars respectively. Jewellery and agricultural products brought 70 billion dollars of revenue in 2016, while the textiles individually earned over 30 billion dollars in 2016, roughly 8 billion dollars more than the previous year.
The growth in the textile industry saw a massive surge in comparison to other industries. The textile industry grew by 15.24% which is way higher than engineered goods that stand second with 8.5% growth. Petroleum having the highest revenue did not receive much growth and had only 3% growth. Among the lowest growing products, agricultural products saw a very minimal 0.81% growth whereas gems and jewellery showcased a negative growth of 5.18%.
Overall, petroleum products, engineering goods, gems and jewellery were the main export items for the country, and the country's export in 2016 increased in these categories except for gems and jewellery while the highest increase was in textile items.
Breaking down into each sector, petroleum products produced the highest export earning for the country, 60 billion dollars in 2015 and it increased by 3% to about 62 billion in 2016. The engineered goods came second, about 58 billion dollars in 2015 and also went up by 8.5% to about 61 billion. However, the gems and jewellery category dropped by 5.18%; it earned about 42 billion dollars in 2015 and 40 billion in the next year. The agricultural products marked a slight uplift which was 30 billion and 31 billion in 2015 and 2016 respectively. As given in the data, the textile products marked the highest growth of 15.24% than the previous year which were about 28 billion in 2015 and 31 billion in 2016.
Report