IELTS Graph # 322 - Changes in ownership of electrical appliances
- Details
- Last Updated: Wednesday, 18 June 2025 00:36
- Written by IELTS Mentor
- Hits: 221841
IELTS Academic Writing Task 1/ Graph Writing - Line Graph:
You should spend about 20 minutes on this task.
The charts below show the changes in ownership of electrical appliances and the amount of time spent doing housework in households in one country between 1920 and 2019.
Summarise the information by selecting and reporting the main features, and make comparisons where relevant.
Write at least 150 words.
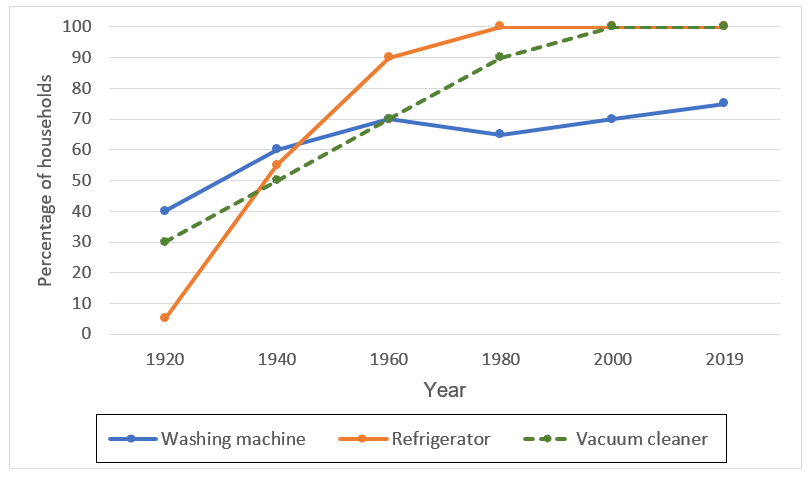
Percentage of households with electrical appliances (1920-2019)
Number of hours of housework* per week, per household (1920 - 2019)
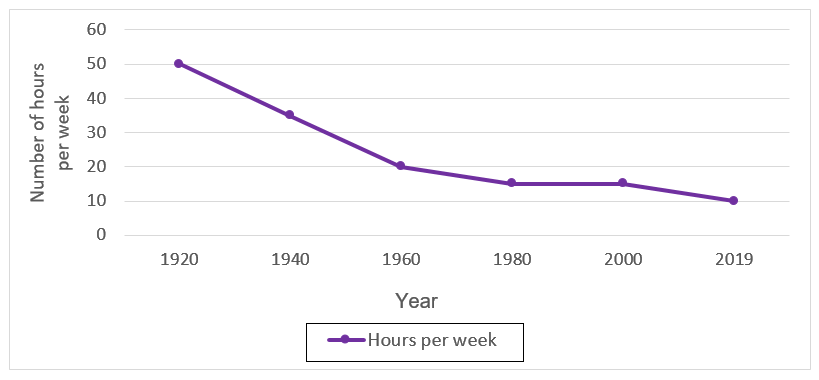
housework* = washing clothes, preparing meals, cleaning.
Model Answer 1:
The first line graph outlines how electrical appliance ownership in households in a country changed during a century, commencing from 1920. The second chart delineates how it had affected the time spent on household work per week by the citizens in this country.
As a general trend, with the increasing number of electrical devices possessed by families, their need for doing housework significantly declined.
As the graph reveals, only 30 percent of households in this country had vacuum cleaners and four out of ten families had washing machines in 1920. Refrigerators were a rare electrical appliance at that time. Just after two decades, however, refrigerator possessions shot up, and almost half of the families owned these three electrical items in their homes. More families started to own such devices and at the beginning of the twenty-first century, almost all households had fridges and vacuum cleaners. The washing machine was owned by more than 70% of families which slowly but steadily increased till 2019. At that point, there was hardly any family without a refrigerator or vacuum cleaner.
It is interesting to note that, with the increasing number of families owning those electrical appliances, their need for doing household work like preparing meals, cleaning and washing clothes remarkably diminished. While they used to work for 50 hours a week doing such work in 1920, it decreased to 20 hours in 1960 and 10 in 2019.
Model Answer 2:
The line graphs show the correlation between the ownership of common household electrical devices and the duration of housework done by families in a country between 1920 and 2019.
Overall, the possession of electrical items by families in this country significantly increased during the period, and as a result, the duration of their weekly housework requirement declined proportionately.
According to the first graph, refrigerators were a rare commodity in houses in 1920, but their presence soared afterwards. Since 1980, every family in this country owned this device at home. A similar, but much smoother trend can be observed with vacuum cleaners, which were present at only three in ten houses a century ago but are now held by 100% of all homes. Lastly, washing machines were owned by 40% of families in 1920 and reached 70% in just four decades. These days, it has remained just below 80%.
The second line chart indicates a direct correlation between the acquisition of essential household appliances and the duration of work required to be done at home. Household work duration dropped dramatically from a high 50 hours per week in 1920 to a mere 10 hours per week in 2019.
Model Answer 3:
The first line graph illustrates the percentage of households that owned electrical appliances - namely washing machines, refrigerators, and vacuum cleaners from 1920 to 2019 in one country. The second graph shows the number of hours spent per week on housework per household during the same period.
Overall, ownership of all three appliances increased over time, with refrigerators and vacuum cleaners experiencing the most dramatic growth, eventually reaching near-universal adoption. Conversely, the average weekly hours spent on housework declined steadily, which shows that increased access to electrical appliances is strongly associated with a marked reduction in household labour over the past century.
In 1920, refrigerators had insignificant ownership in this country, while around 30% of households owned vacuum cleaners and 40% had washing machines. Over the following decades, refrigerator ownership rose sharply, surpassing 90% by 1960 and reaching 100% by 1980. Vacuum cleaner ownership followed a similar trajectory, hitting 100% by 2000. Washing machine ownership grew gradually, climbing to about 70% by 1960 and approximately 75% by 2019.
In contrast, the time spent on housework decreased significantly from 50 hours per week in 1920 to roughly 15 hours in 1980 before levelling off at around 10 hours by 2019. This trend appears inversely related to the growing adoption of household appliances.
Sample Answer 4:
The line graphs illustrate the evolving patterns of household electrical appliance ownership and the corresponding time dedicated to housework in homes in a country from 1920 to 2019.
In general, there was a noticeable surge in the ownership of various electrical appliances throughout the period, which directly correlates with a dramatic reduction in the average number of hours spent on household chores.
In 1920, none of the listed appliances was widely owned - only 30% of households owned vacuum cleaners and 40% washing machines. However, ownership began to rise steadily from 1930 onwards, with refrigerators and vacuum cleaners experiencing the most significant growth. By 1960, approximately 90% of households possessed a refrigerator, a figure that reached virtually 100% by 1980. Similarly, vacuum cleaner ownership soared from about 30% in 1920 to over 90% by 1980, achieving near-universal penetration by 2019. The washing machine also saw a substantial increase, reaching around 70% ownership by 1970.
Concomitantly, the average weekly hours spent on housework witnessed a steep decline. Starting at a considerable 50 hours per week in 1920, this figure plummeted to approximately 30 hours by 1960. The downward trend continued, with housework hours stabilising at 10 hours per week by 2019, reflecting the increasing automation of domestic tasks.

In general, due to the introduction of these technologies, the work rate in most of the houses had significantly been reduced.
At the beginning of the twentieth century, only a few electrical appliances were seen but now every home possesses most of them. For instance, in 1920, there were only a few refrigerators which increased to such an extent that there were no homes without them. Similarly, the ownership of vacuum cleaners constantly increased from 30 to 40%, with every household consisting of them. There was a great demand for washing machines in the past, but there are many homes at present with washing machines, which increased by about 25%.
Moreover, due to the presence of these devices and the developing technologies, people are doing less work compared to the past. For instance, washing clothes, preparing meals, and cleaning requires fewer hours compared to the past century. The number of hours of housework per week kept decreasing from 50 hours in 1920 to 20 hours in 1960 and 10 hours in 2019.
Overall, a significant increase in the use of washing machines, refrigerators, and vacuum cleaners could be observed in this country between 1920 and 2019 and as a result, the need for household work done by people in the country decreased noticeably.
In the first graph, the washing machine leads the three devices in usage, at 40%. However, by 1960 it has become the lowest-used machine equalling vacuum cleaners, at 70%. From this point, the growth was very less until the end of the period with just a mere 2-4% increase. The vacuum cleaner was the second most used device with 30 out 100 people using it in 1920, grew slightly every two decades with no serious fluctuations to 100% by 2000, and stayed there till 2019. Refrigerators with less than 1% of users in 1920 saw an astronomic rise to 90 % in 40 years, from here a small increase to 100% in 1980, which remained unchanged for the next 39 years.
In the second line graph, it is clear that time spent on housework took a hit in the span of 100 years. On average 50 hours were spent in 1920 which fell down steadily all the way to 10 hours by the end of the period.
Report