Graph Writing # 53 - Participation of men in senior development in three companies
- Details
- Last Updated: Wednesday, 30 July 2025 11:17
- Written by IELTS Mentor
- Hits: 70104
IELTS Academic Writing Task 1/ Graph Writing - Column Graph:
» You should spend about 20 minutes on this task.
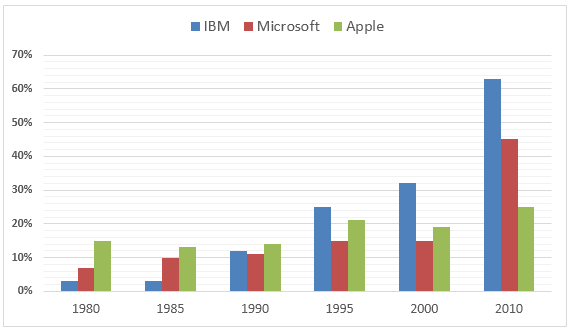
The bar chart below shows the percentage participation of men in senior development in three companies between 1980 and the year 2010.
Summarise the information by selecting and report in the main features, and make comparisons where relevant.
» Write at least 150 words
Percentage of participation of men in senior development positions
Sample Answer 1:
The provided bar graph compares the number of male senior developers in three major software companies namely IBM, Microsoft and Apple between 1980 and 2010. As is presented in the graph, Initially Apple had the largest percentage of senior development employees but after 30 years IBM employed the largest percentage of such employees.
As is presented in the bar graph, initially in 1980, IBM had less than 3% senior male developers while Microsoft had 8% and Apple had about 15% such senior developers. After a decade, in 1990 to be exact, the percentage of senior male developers became almost the same for these companies. In 1995, the percentage of senior male employees in IBM became the highest and this kept on increasing till 2010. Finally, in 2010, IBM had the largest percentage of such employees making more than 60% while Microsoft had 45% and Apple had about 25% of such senior developers.
In summary, the number of male senior developers increased in all the three companies but the rate of increase in IBM and Microsoft were far higher than Apple.
Model Answer 2:
The diagram outlines how the ratio of senior male developers increased between 1980 and 2010 in three tech companies, namely IBM, Microsoft and Apple. Overall, the senior male developers’ ratio in IBM increased remarkably despite its lowest percentage of such developers in early years.
As is presented in the bar chart, Apple had the highest ratio of males in senior development positions, roughly 15%, in 1980 whereas Microsoft employed nearly 7% such males in senior developer position. IBM, on the contrary, had only around 3% males in higher positions in the development sector, which was the lowest. After a decade, the ratio of such employees in these tech companies accounted for roughly 10-12%. Afterwards, the proportion of male developers in higher posts in IBM noticeably increased and in 2010 well over half of the employees in IBM were male developers. Apple, on the other hand, retained almost one-quarter of such employees while Microsoft’s male developers in leading positions went as high as 45% in 2010.

Initially, in 1980, IBM had only 3% of male officials who were in senior positions, while they made up around 7% and 15% in Microsoft and Apple. This proportion in IBM skyrocketed, as it reached a quarter after 15 years and became over 60% after another 15 years. At the same time, in 2010, despite prior decreases, such figure of Apple surpassed 20% and stood just under a quarter in 2010.
Percentage of male senior officials in Microsoft stood at 15% in the year 2000 but then increased 3-fold in just 10 years. It is worth noticing that after 30 years, Apple had the lowest proportion of participation of such employees in senior positions.
Report