IELTS Bar Graph (Part 4)
- Details
- Last Updated: Saturday, 24 March 2018 20:07
- Written by IELTS Mentor
- Hits: 55520
IELTS Academic writing task 1 - Bar Graph (part 4)
Links to all Bar Graph pages:
Bar Graphs - | Part 1 | Part 2 | Part 3 | Part 4 | Part 5 | Part 6 | Part 7 |
This page, IELTS bar graphs (part 4), provides few more Bar graph questions with answers. Those are mostly taken from Academic Writing Task 1 exam and they provide an excellent opportunity to you to practise before you seat for your Academic Writing test. Some bar graphs are quite simple and depict simple data while some could be fairly complex as they present a complex set of data. We would advise you to practise all those samples to get ready for the test.
IELTS Bar Graph Sample 61: with model answers
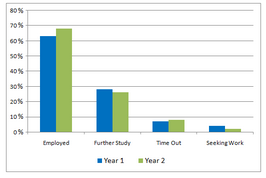
[IELTS Bar Graph: The bar chart below shows the percentage of unemployed graduates, aged 20-24, in one European country over a two-year period.]

IELTS Bar Graph Sample 62: with model answers
[IELTS Bar Graph: The graph and bar chart below show the average monthly rainfall and temperature for one region of East Africa.]

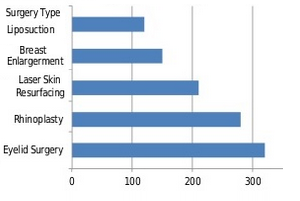
IELTS Bar Graph Sample 63: with model answers
[IELTS Bar Graph: The graphs below compare the number of cosmetic procedures performed on males and females in Korea in 2004.]
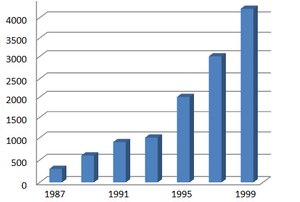
IELTS Bar Graph Sample 64: with model answers
[IELTS Bar Graph: The graph below shows the number of vehicles owned by per thousand people in China from 1987 to 1999.]
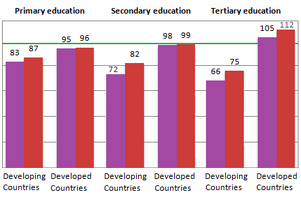
IELTS Bar Graph Sample 65: with model answers
[IELTS Bar Graph: The chart below shows the number of girls per 100 boys enrolled in different levels of school education.]
IELTS Bar Graph Sample 66: with model answers
[IELTS Bar Graph: The chart shows average levels of rainfall in Marley in the UK.]
IELTS Bar Graph Sample 67: with model answers
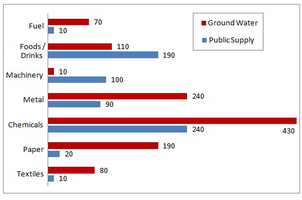
[IELTS Bar Graph: The graph below shows usual water usage (in millions of cubic meters) by industries in some countries in a year.]
IELTS Bar Graph Sample 68: with model answers
[IELTS Bar Graph: The bar chart below gives information about vehicle ownership in China.]
IELTS Bar Graph Sample 69: with model answers
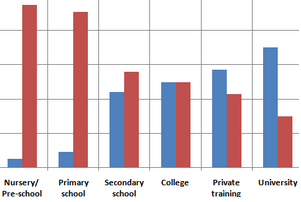
[IELTS Bar Graph: The chart below shows the percentage of male and female teachers in six different types of educational setting in the UK in 2010.]
IELTS Bar Graph Sample 70: with model answers
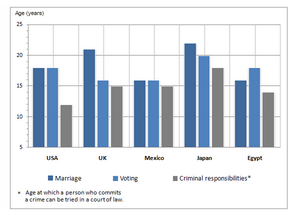
[IELTS Bar Graph: The figure shows the results of a survey of 1000 adolescents in five different countries. The participants were asked at what age they believed certain rights and responsibilities should be granted to young people.]
IELTS Bar Graph Sample 71: with model answers
[IELTS Bar Graph: The chart below shows the numbers of male and female research students studying six science-related subjects at a UK university in 2009.]

IELTS Bar Graph Sample 72: with model answers
[IELTS Bar Graph: The charts below show what the business and engineering graduates of a particular university were doing six months after graduating. The figures cover a two-year period.]
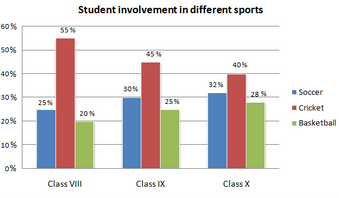
IELTS Bar Graph Sample 73: with model answers
[IELTS Bar Graph: The graph below shows the student involvement in three sports in a school based on which grades they are studying in.]
IELTS Bar Graph Sample 74: with model answers
[IELTS Bar Graph: The graph and table below show the number of fishers in millions for different regions in 1980, 1990, and 2000, and the world's top exporters of fish in 2000.]

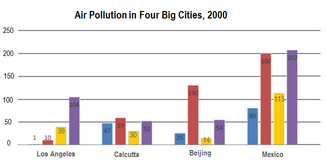
IELTS Bar Graph Sample 75: with model answers
[IELTS Bar Graph: The chart below shows the average daily minimum and maximum levels of two air pollutants in four big cities in 2000.]
IELTS Bar Graph Sample 76: with model answers
[IELTS Bar Graph: The graph compares the percentage of international and the percentage of UK students gaining second class degrees or better at a major UK University in 2009.]

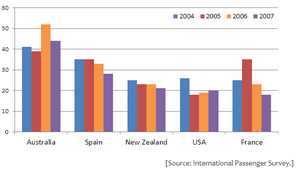
IELTS Bar Graph Sample 77: with model answers
[IELTS Bar Graph: The chart shows British Emigration to selected destinations between 2004 and 2007.]
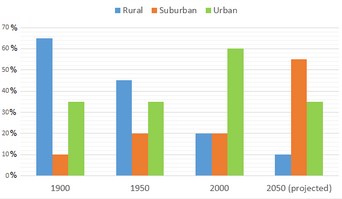
IELTS Bar Graph Sample 78: with model answers
[IELTS Bar Graph: The graph below shows the figures for population distribution in the Northwest Region for 1900-2050.]
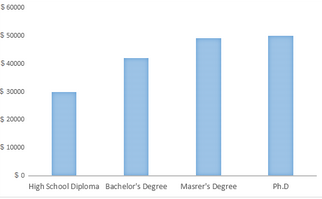
IELTS Bar Graph Sample 79: with model answers
[IELTS Bar Graph: The graph below shows the average salaries earned by people with different levels of education.]
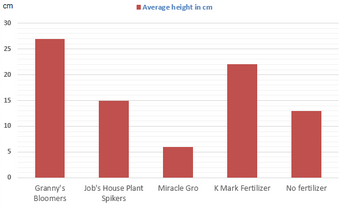
IELTS Bar Graph Sample 80: with model answers
[IELTS Bar Graph: The graph below shows the effects of different brands of fertilizer on bean plant growth.]
« Previous (Bar Graph 41- 60) Next (Bar Graph 81-100) »

Report