IELTS Bar Graph (Part 2)
- Details
- Last Updated: Saturday, 19 May 2018 19:30
- Written by IELTS Mentor
- Hits: 116765
IELTS Academic writing task 1 - Bar Graph (part 2)
Links to all Bar Graph pages:
Bar Graphs - | Part 1 | Part 2 | Part 3 | Part 4 | Part 5 | Part 6 | Part 7 |
Following is the list of IELTS bar graphs (part 2) with the links to model answers that you should practice for your Academic IELTS test.
IELTS Bar Graph Sample 21: with model answers
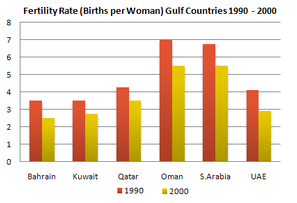
[Bar Graph Question: The graph below shows the fertility rate of women of different Gulf Countries from 1990 to 2000.]
IELTS Bar Graph Sample 22: with sample answers
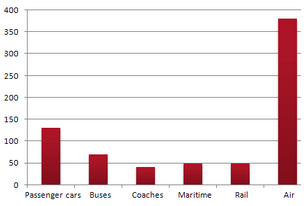
[Bar Graph Question: The table below shows CO2 emissions for different forms of transport in the European Union. The Pie Chart shows the percentage of European Union funds being spent on different forms of transport.]
IELTS Bar Graph Sample 23: with sample answers
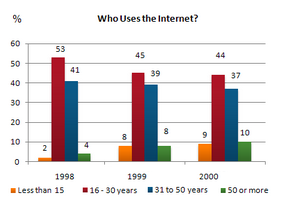
[Bar Graph Question: The graph shows Internet Usage in Taiwan by Age Group, 1998-2000.]
IELTS Bar Graph Sample 24: with model answers
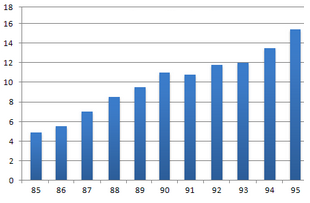
[Bar Graph Question: The charts below show the number of Japanese tourists traveling abroad between 1985 and 1995 and Australia's share of the Japanese tourist market.]
IELTS Bar Graph Sample 25: with model answers
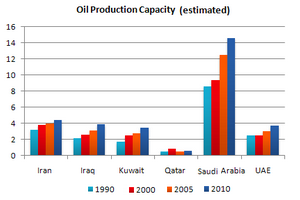
[Bar Graph Question: The graph shows estimated oil production capacity for several Gulf countries between 1990 and 2010.]
IELTS Bar Graph Sample 26: with model answers
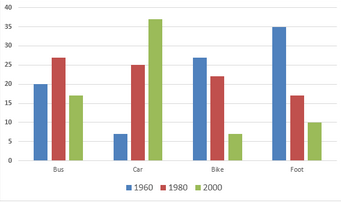
[Bar Graph Question: The graph below shows the different modes of transport used to travel to and from work in one European city in 1960, 1980 and 2000.]
IELTS Bar Graph Sample 27: with model answers
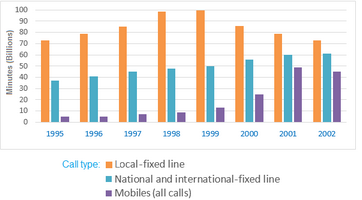
[Bar Graph Question: The chart below shows the total number of minutes (in billions) of telephone calls in the UK, divided into three categories, from 1995-2002. ]
IELTS Bar Graph Sample 28: with model answers
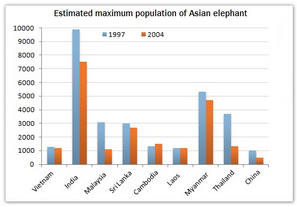
[Bar Graph Question: The graph below shows the changes in maximum number of Asian elephants between 1994 and 2007.]
IELTS Bar Graph Sample 29: with model answers
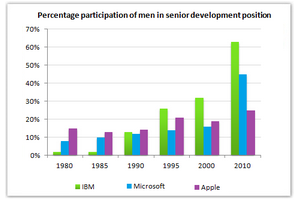
[Bar Graph Question: The bar chart below shows the percentage participation of men in senior development in three companies between 1980 and the year 2010.]
IELTS Bar Graph Sample 30: with model answers
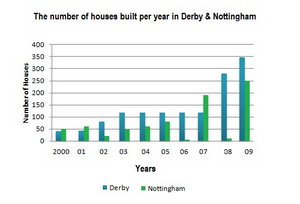
[Bar Graph Question: The diagram below shows the number of houses built per year in two cities, Derby and Nottingham, Between 2000 and 2009.]
IELTS Bar Graph Sample 31: with sample answers
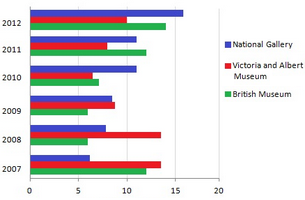
[Bar Graph Question: The bar chart shows the number of visitors to three London Museums between 2007 and 2012.]
IELTS Bar Graph Sample 32: with sample answers
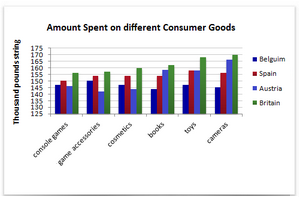
[Bar Graph Question: The bar chart below gives information about four countries spending habits of shopping on consumer goods in 2012.]
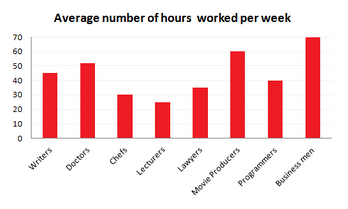
IELTS Bar Graph Sample 33: with sample answers
[Bar Graph Question: The graphs show figures relating to hours worked and stress levels amongst professionals in eight groups.]
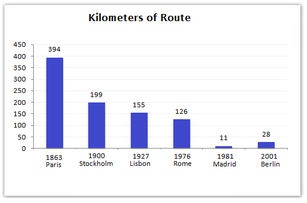
IELTS Bar Graph Sample 34: with sample answers
[Bar Graph Question: The bar charts below give information about the railway system in six cities in Europe. ]
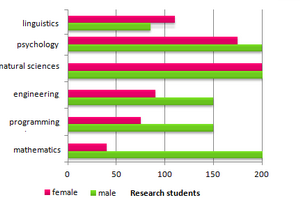
IELTS Bar Graph Sample 35: with sample answers
[Bar Graph Question: The bar graph below shows the numbers of male and female research students studying six subjects at a US university in 2011.]
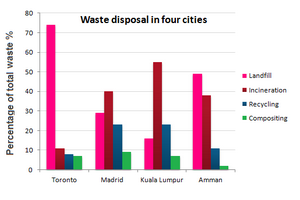
IELTS Bar Graph Sample 36: with sample answers
[Bar Graph Question: The bar chart shows different methods of waste disposal in four cities: Toronto, Madrid, Kuala Lumpur and Amman.]
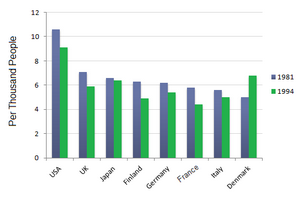
IELTS Bar Graph Sample 37: with model answers
[Bar Graph Question: The bar charts below show the Marriage and Divorce Statistics for nine countries in 1981 and 1994.]
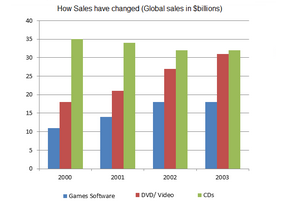
IELTS Bar Graph Sample 38: with model answers
[Bar Graph Question: The chart below gives information about global sales of games software, CDs and DVD or video.]
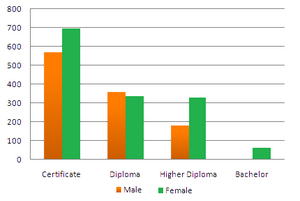
IELTS Bar Graph Sample 39: with model answers
[Bar Graph Question: The graphs show enrolment in different colleges in the Higher Colleges of Technology in 1999.]
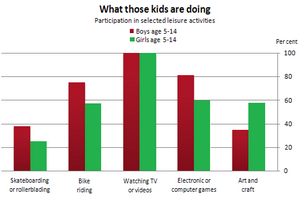
IELTS Bar Graph Sample 40: with model answers
[Bar Graph Question: The graph below gives information about the preferred leisure activities of Australian children.]
« Previous (Bar Graph 1- 20) Next (Bar Graph 41-60) »

Report