IELTS Bar Graph (Part 6)
- Details
- Last Updated: Saturday, 24 March 2018 20:10
- Written by IELTS Mentor
- Hits: 49888
IELTS Academic writing task 1 - Bar Graph (part 6)
Links to all Bar Graph pages:
Bar Graphs - | Part 1 | Part 2 | Part 3 | Part 4 | Part 5 | Part 6 | Part 7 |
IELTS bar graphs (part 6) section includes few more IELTS Bar Graph samples for Academic IELTS test takers. Each question comes with sample answers for the convenience of the candidates to practise and to prepare for the test.
IELTS Bar Graph Sample 101: with model answers
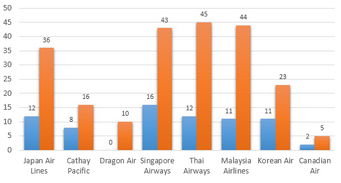
[IELTS Bar Graph: The graph below presents the number of different airline flights coming to Hong Kong per week in 1980 and 2000.]
IELTS Bar Graph Sample 102: with model answers
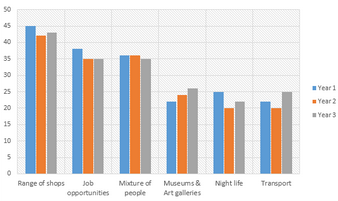
[IELTS Bar Graph: The bar charts and line graph below show the results of a survey conducted over a three-year period to discover what people who live in London think of the city.]
IELTS Bar Graph Sample 103: with model answers
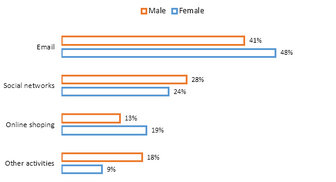
[IELTS Bar Graph: The chart below shows the male and female internet users aged 15-24 in Canada in 2000.]
IELTS Bar Graph Sample 104: with model answers
[IELTS Bar Graph: The bar charts below show the number of hours each teacher spent teaching in different schools in four different countries in 2001.]

IELTS Bar Graph Sample 105: with model answers
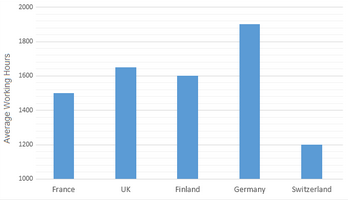
[IELTS Bar Graph: The bar charts below show the average of annual working hours and the average duration of holidays in five European countries.]
IELTS Bar Graph Sample 106: with model answers
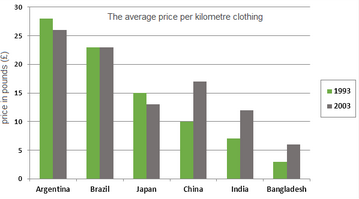
[IELTS Bar Graph: The average prices per kilometre of clothing imported into the European Union from six different countries in 1993 and 2003 are shown in the bar chart below.]
IELTS Bar Graph Sample 107: with model answers
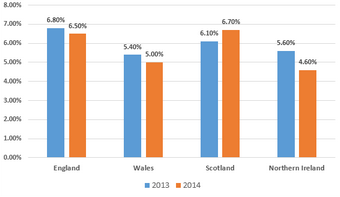
[IELTS Bar Graph: The following graph shows the percentage of unemployment rates for the female in the UK.]
IELTS Bar Graph Sample 108: with model answers
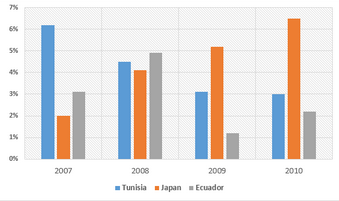
[IELTS Bar Graph: The chart below shows the GDP growth per year for three countries between 2007 and 2010.]
IELTS Bar Graph Sample 109: with model answers
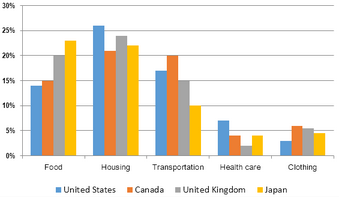
[IELTS Bar Graph: The bar chart below shows shares of expenditures for five major categories in the United States, Canada, the United Kingdom, and Japan in the year 2009.]
IELTS Bar Graph Sample 110: with model answers
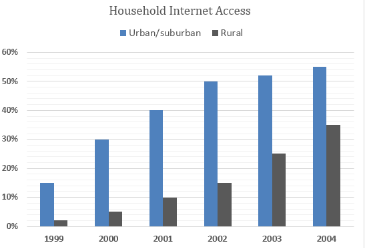
[IELTS Bar Graph: The graph below shows the percentage of urban/suburban and rural households in a European country that had Internet access between 1999 and 2004.]
IELTS Bar Graph Sample 111: with model answers
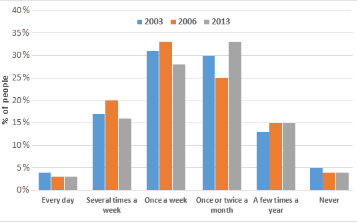
[IELTS Bar Graph: The chart below shows how frequently people in the USA ate at fast food restaurants between 2003 and 2013.]
IELTS Bar Graph Sample 112: with model answers
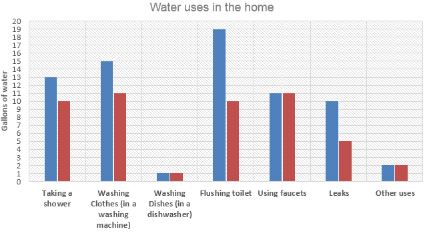
[IELTS Bar Graph: The graph below shows the daily water consumption for Americans in their homes.]
IELTS Bar Graph Sample 113: with model answers
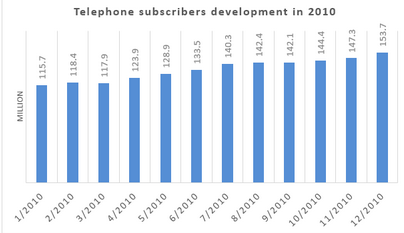
[IELTS Bar Graph: The chart below shows how the telephone subscribers in Vietnam developed throughout the year 2010.]
IELTS Bar Graph Sample 114: with model answers
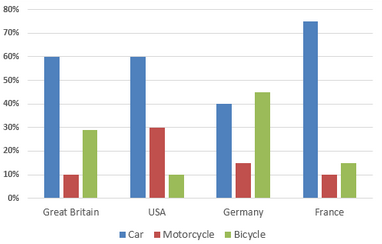
[IELTS Bar Graph: The chart below shows the type of transports young people in four countries prefer to use.]
IELTS Bar Graph Sample 115: with model answers
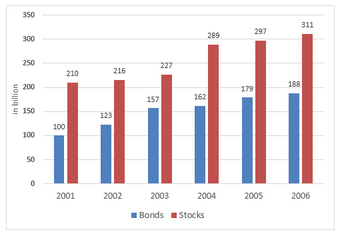
[IELTS Bar Graph: The graph below shows the way people of a country invested their money in the stock market during the years 2001-2006.]
IELTS Bar Graph Sample 116: with model answers
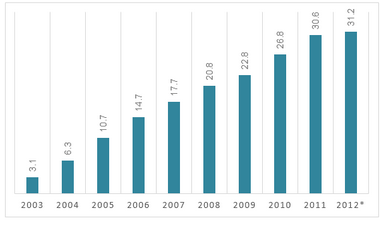
[IELTS Bar Graph: The graph below shows total internet users in Vietnam from 2003 to the second quarter 2012.]
IELTS Bar Graph Sample 117: with model answers
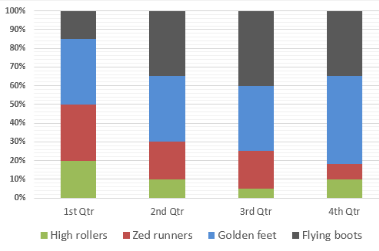
[IELTS Bar Graph: The graph below shows the percentage sales of trainers made by a sportswear company in one year.]
IELTS Bar Graph Sample 118: with model answers
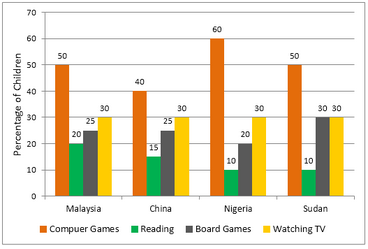
[IELTS Bar Graph: The graph below shows the different home activities among young children in four different countries.]
IELTS Bar Graph Sample 119: with model answers
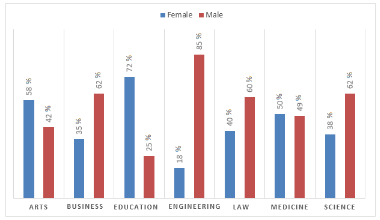
[IELTS Bar Graph: The graph shows the percentage of male and female academic staff members across the faculties of a major university in 2016.]
IELTS Bar Graph Sample 120: with model answers
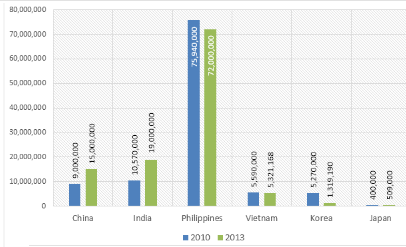
[IELTS Bar Graph: The graph below gives information about the number of Catholics residing in different nations, during 2010-2013.]
« Previous (Bar Graph 81- 100) Next (Bar Graph 121-140) »

Report