IELTS Bar Graph (Part 5)
- Details
- Last Updated: Saturday, 24 March 2018 20:08
- Written by IELTS Mentor
- Hits: 43604
IELTS Academic writing task 1 - Bar Graph (part 5)
Links to all Bar Graph pages:
Bar Graphs - | Part 1 | Part 2 | Part 3 | Part 4 | Part 5 | Part 6 | Part 7 |
IELTS bar graphs (part 5) page contains 20 more IELTS Bar Graph samples with links to the model answers. These samples are useful for your exam preparation (for Academic IELTS test takers.) Practise them, write few answers on your own and get ready to answer any bar graphs that you might encounter in your IELTS Academic Writing Task 1.
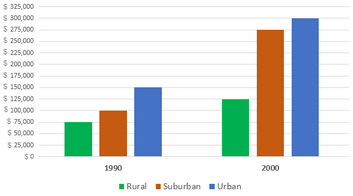
IELTS Bar Graph Sample 81: with model answers
[IELTS Bar Graph: The graph below shows the average cost of housing in three different areas.]
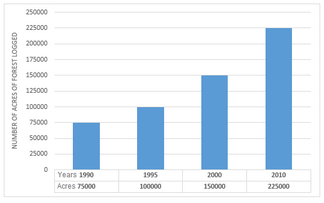
IELTS Bar Graph Sample 82: with model answers
[IELTS Bar Graph: The bar graph below shows the area of forest logged in Southwest region and the table presents the number of forest-dwelling species in the same region.]
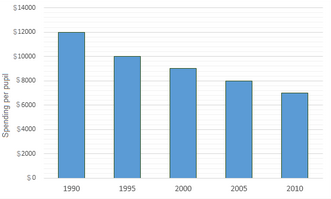
IELTS Bar Graph Sample 83: with model answers
[IELTS Bar Graph: The bar graphs below show the Riverdale Public School’s spending per student in a year as well as percentages of students who passed the reading and math tests from 1990 to 2005.]
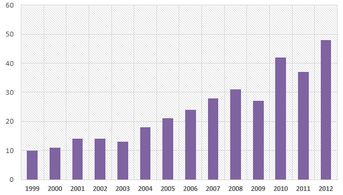
IELTS Bar Graph Sample 84: with model answers
[IELTS Bar Graph: The bar chart below shows the global sales of televisions by Supervision Incorporation from 1999 to 2012.]
IELTS Bar Graph Sample 85: with model answers
[IELTS Bar Graph: The graph below shows the destinations of holidaymakers from a particular Asian country in 2012.]
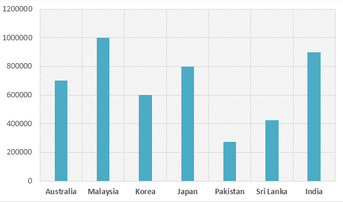
IELTS Bar Graph Sample 86: with model answers
[IELTS Bar Graph: The graph presents percentages of commuters using different modes of transports in London in the years 1960, 1980, 2000 and 2010.]
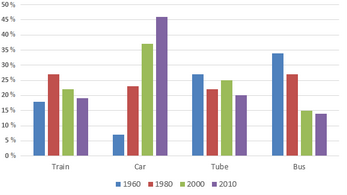
IELTS Bar Graph Sample 87: with model answers
[IELTS Bar Graph: The bar chart below shows the proportions of English men and women of different ages who were living alone in 2011. The pie chart compares the numbers of bedrooms in these one-person households.]
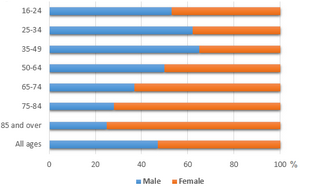
IELTS Bar Graph Sample 88: with model answers
[IELTS Bar Graph: The chart below shows the main reasons for university education among people of different age groups, based on a survey conducted in 2008, and the percentages of students who got support from their employers in this year.]
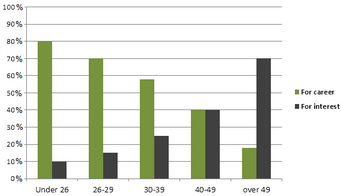
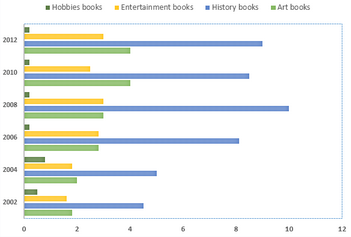
IELTS Bar Graph Sample 89: with model answers
[IELTS Bar Graph: The chart below shows the changes in sales of four different types of books from 2002 to 2012.]
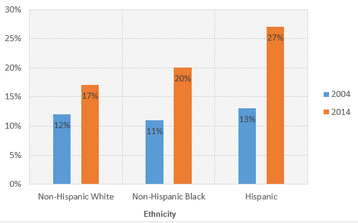
IELTS Bar Graph Sample 90: with model answers
[IELTS Bar Graph: The bar charts below show the prevalence of obesity among boys and girls aged 12 to 19 years by ethnicity, in the United States for the years 2004 and 2014.]
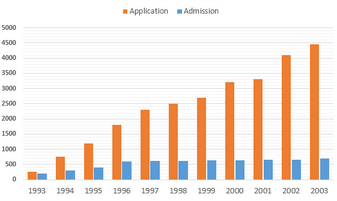
IELTS Bar Graph Sample 91: with model answers
[IELTS Bar Graph: The graph below shows the comparison between the number of applicants and the number of students who were granted admission in a university. ]
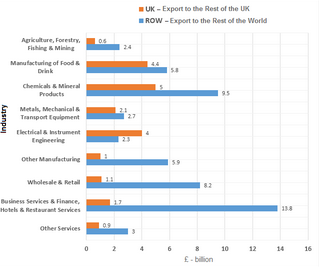
IELTS Bar Graph Sample 92: with model answers
[IELTS Bar Graph: The bar chart below shows Scotland’s exports to the rest of the UK and the rest of the world for the year 2014.]
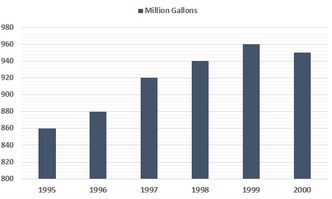
IELTS Bar Graph Sample 93: with model answers
[IELTS Bar Graph: The column graph below shows the consumption of regular ice cream in the US market.]
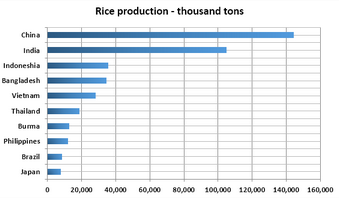
IELTS Bar Graph Sample 94: with model answers
[IELTS Bar Graph: The bar chart below provides information about the top ten rice producing countries in the world in 2015.]
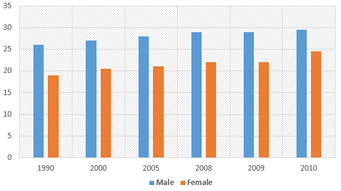
IELTS Bar Graph Sample 95: with model answers
[IELTS Bar Graph: The graph below shows the percentages of male and female US citizens who never married.]
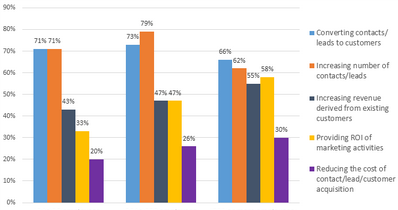
IELTS Bar Graph Sample 96: with model answers
[IELTS Bar Graph: The graph below shows the top priorities by business companies in the USA in 2016.]
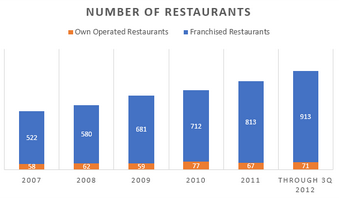
IELTS Bar Graph Sample 97: with model answers
[IELTS Bar Graph: The bar graph below shows the number of own operated and Franchised restaurants from 2007 to 2012 in Someland.]
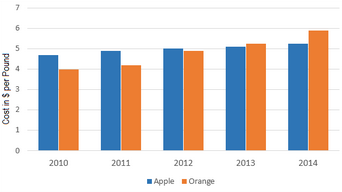
IELTS Bar Graph Sample 98: with model answers
[IELTS Bar Graph: The graph below shows how the prices of apples and oranges changed between 2010 and 2014 in Australia.]
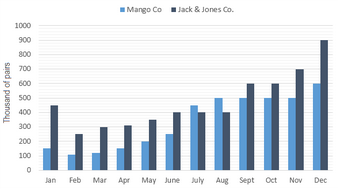
IELTS Bar Graph Sample 99: with model answers
[IELTS Bar Graph: The bar chart below shows the estimated sales of jeans for two companies next year in Turkey. The pie chart shows the projected market share of the two companies in jeans at the end of next year.]
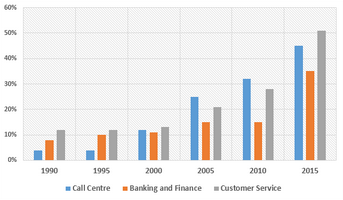
IELTS Bar Graph Sample 100: with model answers
[IELTS Bar Graph: The chart below shows the percentage of female employees in three job sectors in Greece from 1990 to 2015.]
« Previous (Bar Graph 61- 80) Next (Bar Graph 101-120) »

Report